Key Findings
Travelling to the trail
Most people drive to the trail
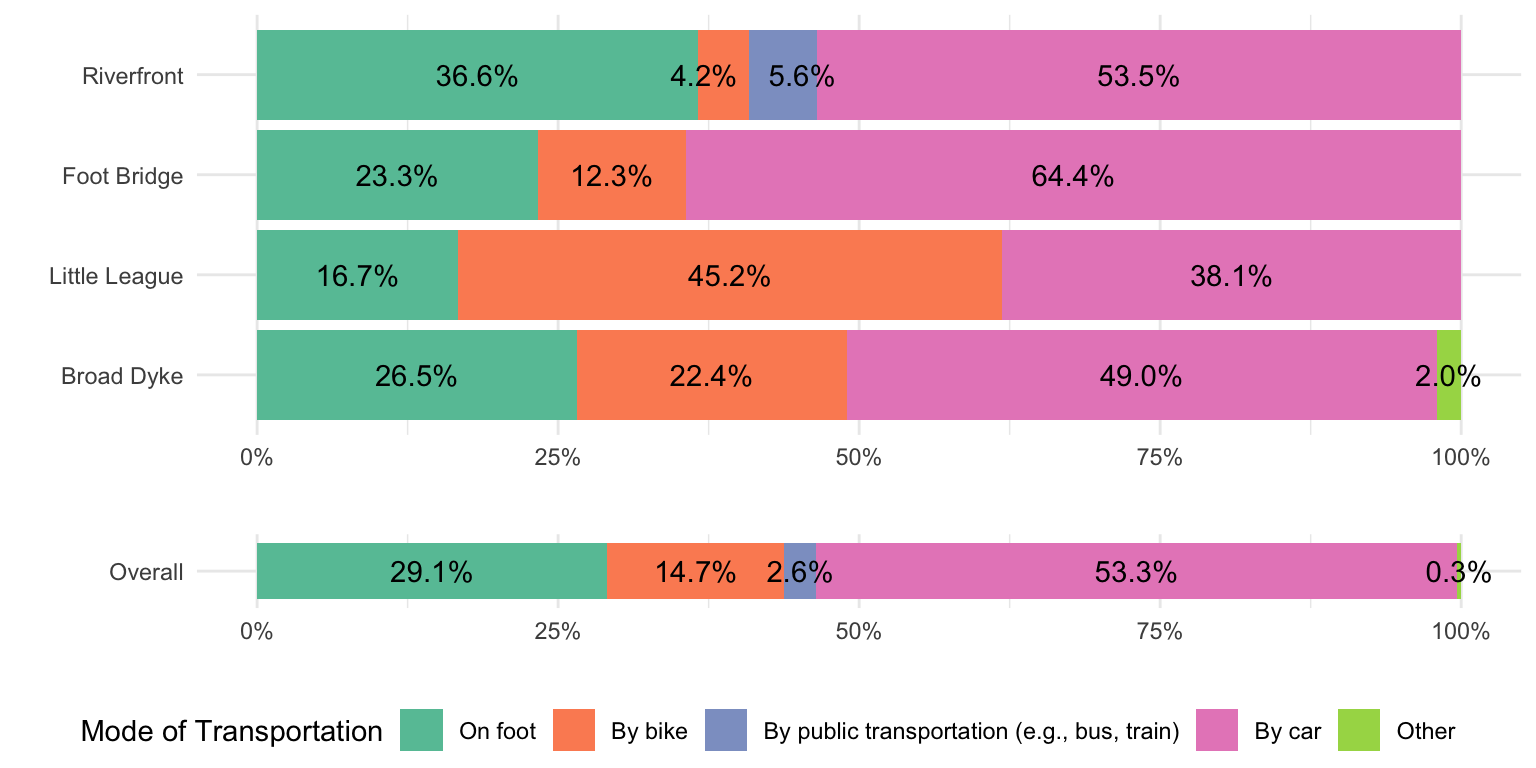
Figure 2: Mode of transportation to the trail across locations. Participants at the Riverfront location were less likely to use bikes to access the trail, compared with other locations. Participants at the Little League location were more likely to use bikes, compared with other locations. (Details)
Most people enter and exit at the same place—suggesting a recreational, rather than transportational use by many
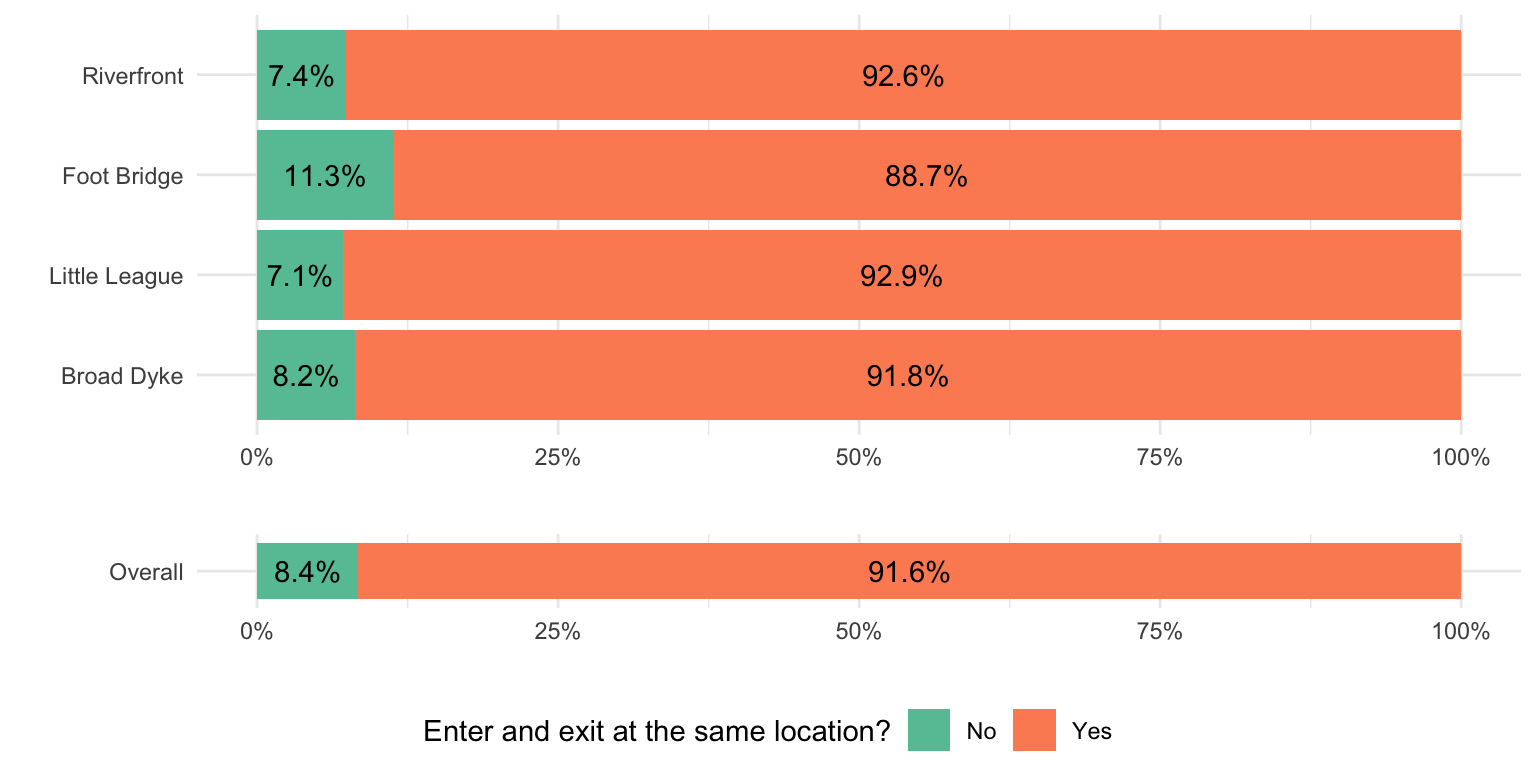
Figure 3: Proportions of trail users exiting and entering from the same place at the trail across locations. We did not find differences in proportions across the locations. (Details)
Most people spend less than 30 minutes to get to the trail
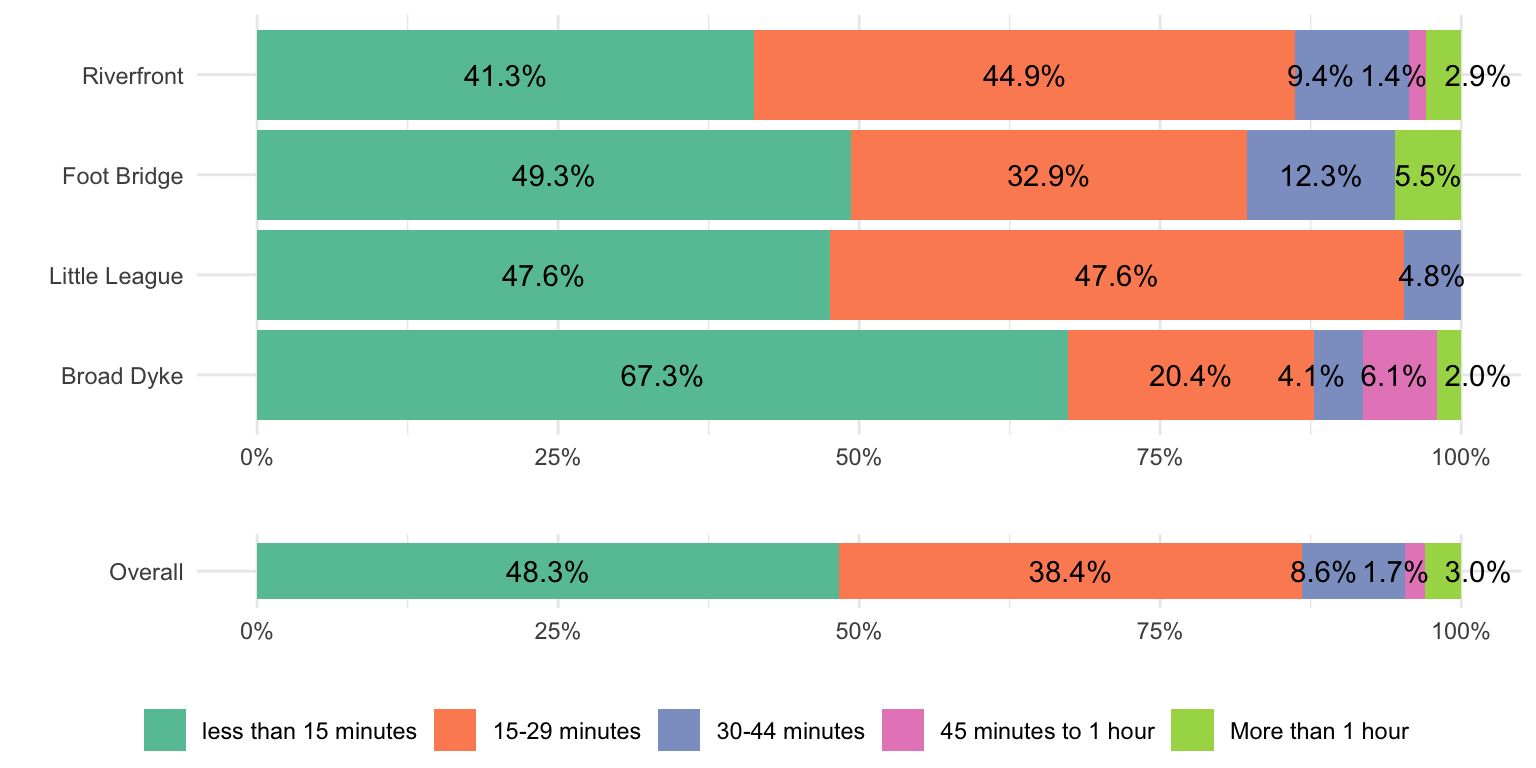
Figure 4: Travel time to the trail. Participants at the Broad Dyke location were more likely to report spending less than 15 minutes to get to the trail compared with other locations. (Details)
Trail use
The trail is used mostly for exercising
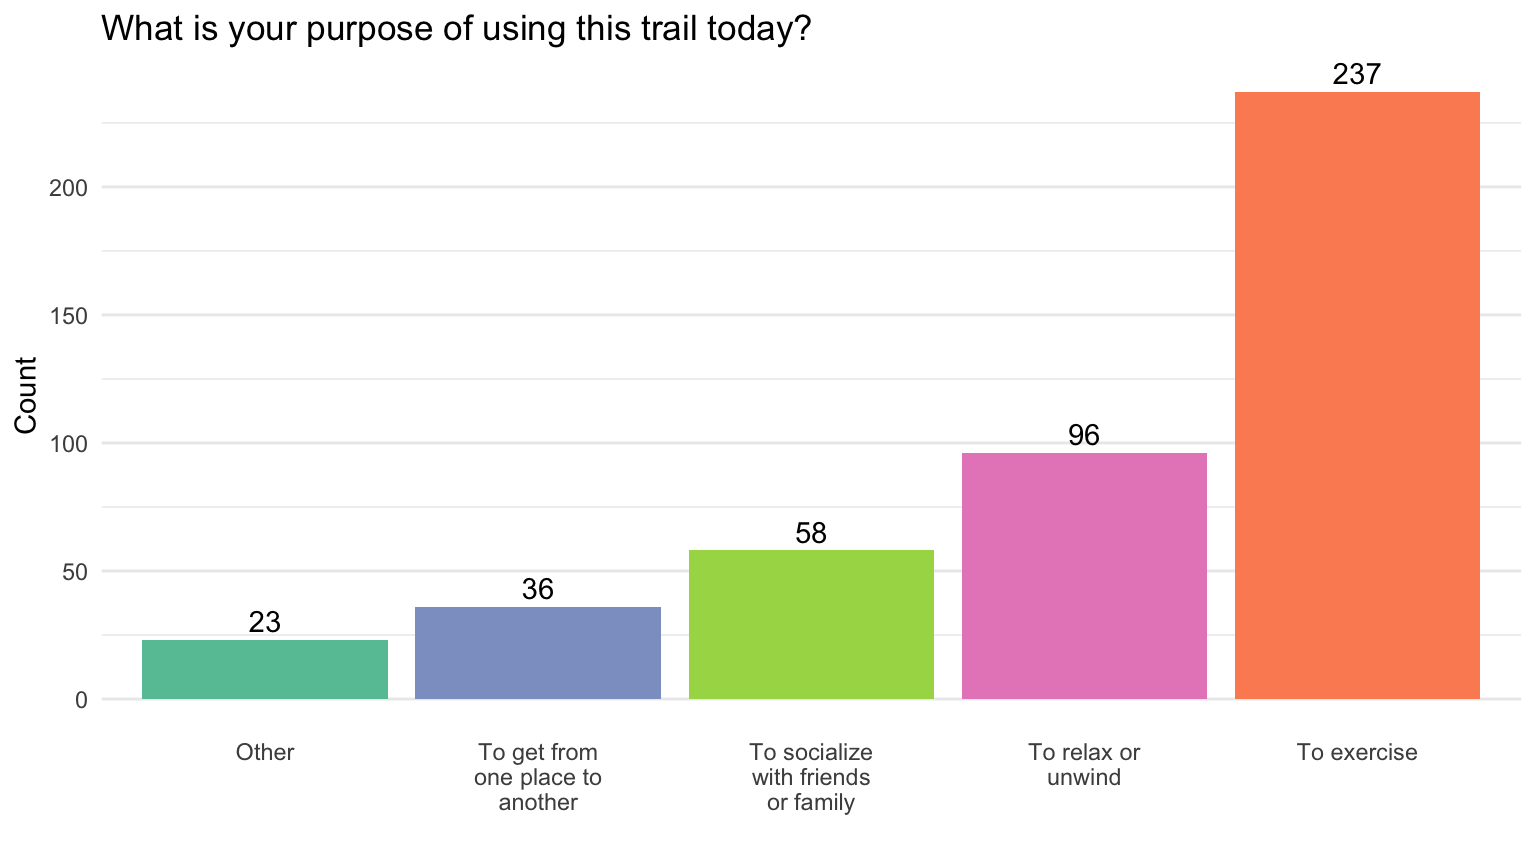
Figure 5: The most purpose of using the trail was to exercise. (Details)
The most popular activity is walking, followed by biking and running
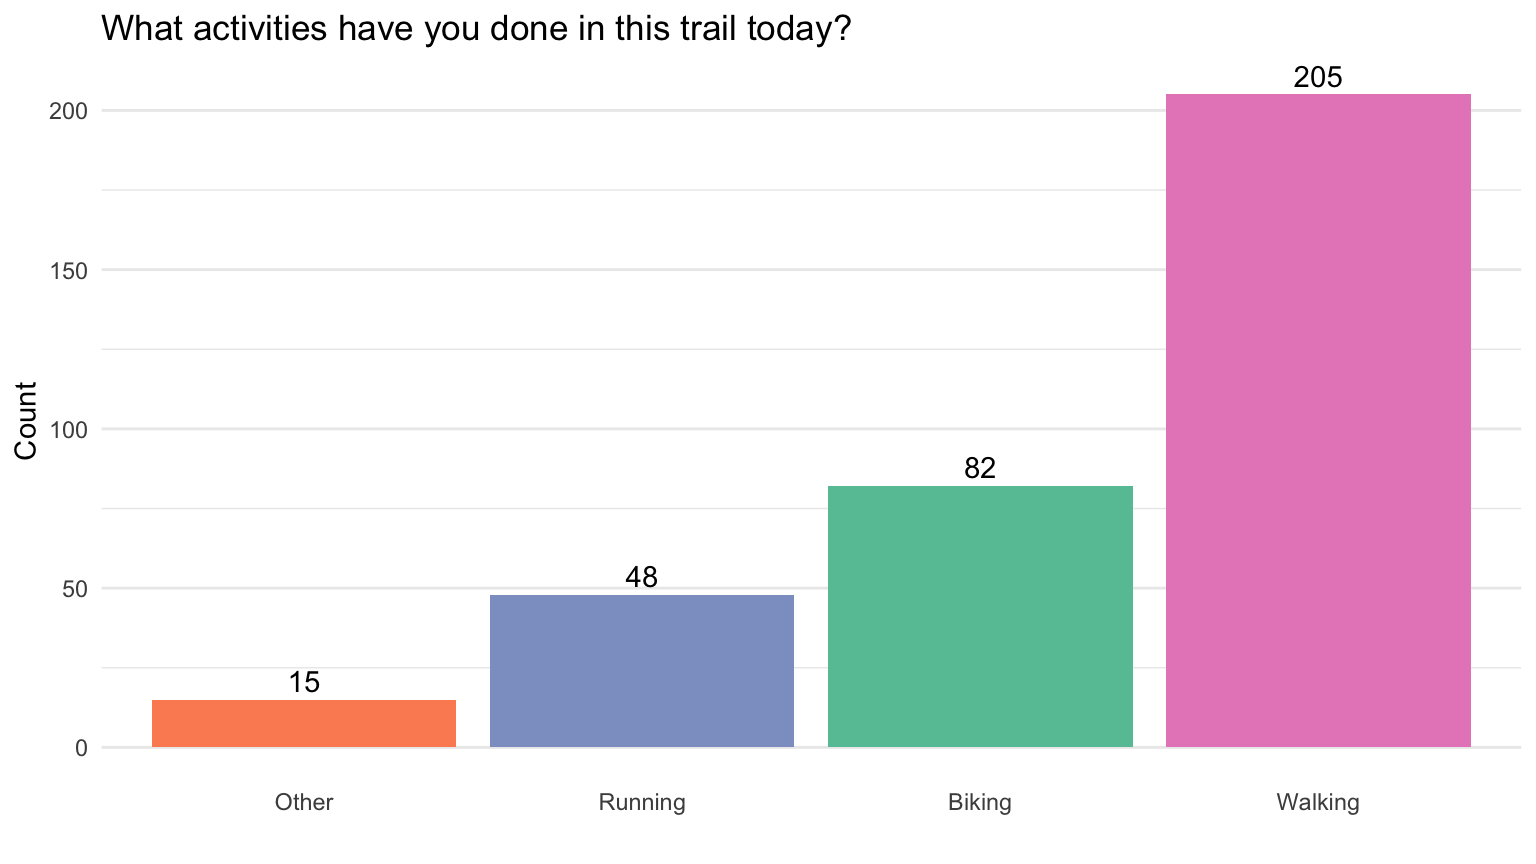
Figure 6: Type of activities. The most popular activity may be walking. More trail users may be biking than running. (Details)
Majority of trail users visit the trail at least once a week
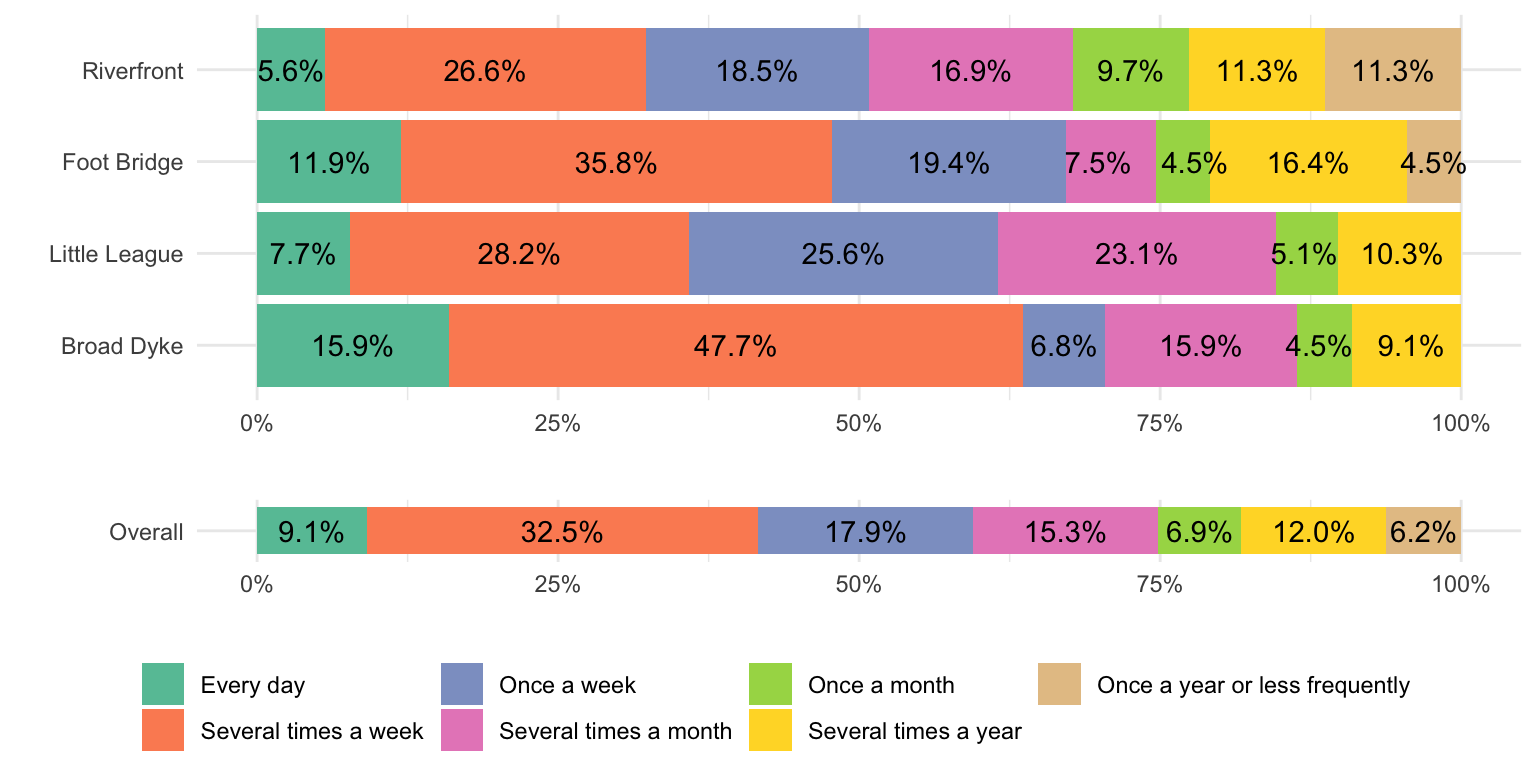
Figure 7: Frequency of visit. Participants at the Riverfront location were more likely to report that they use the trail once a year or less frequently than those at the other locations. (Details)
Majority of trail users spend 45+ mintues per week at the trail
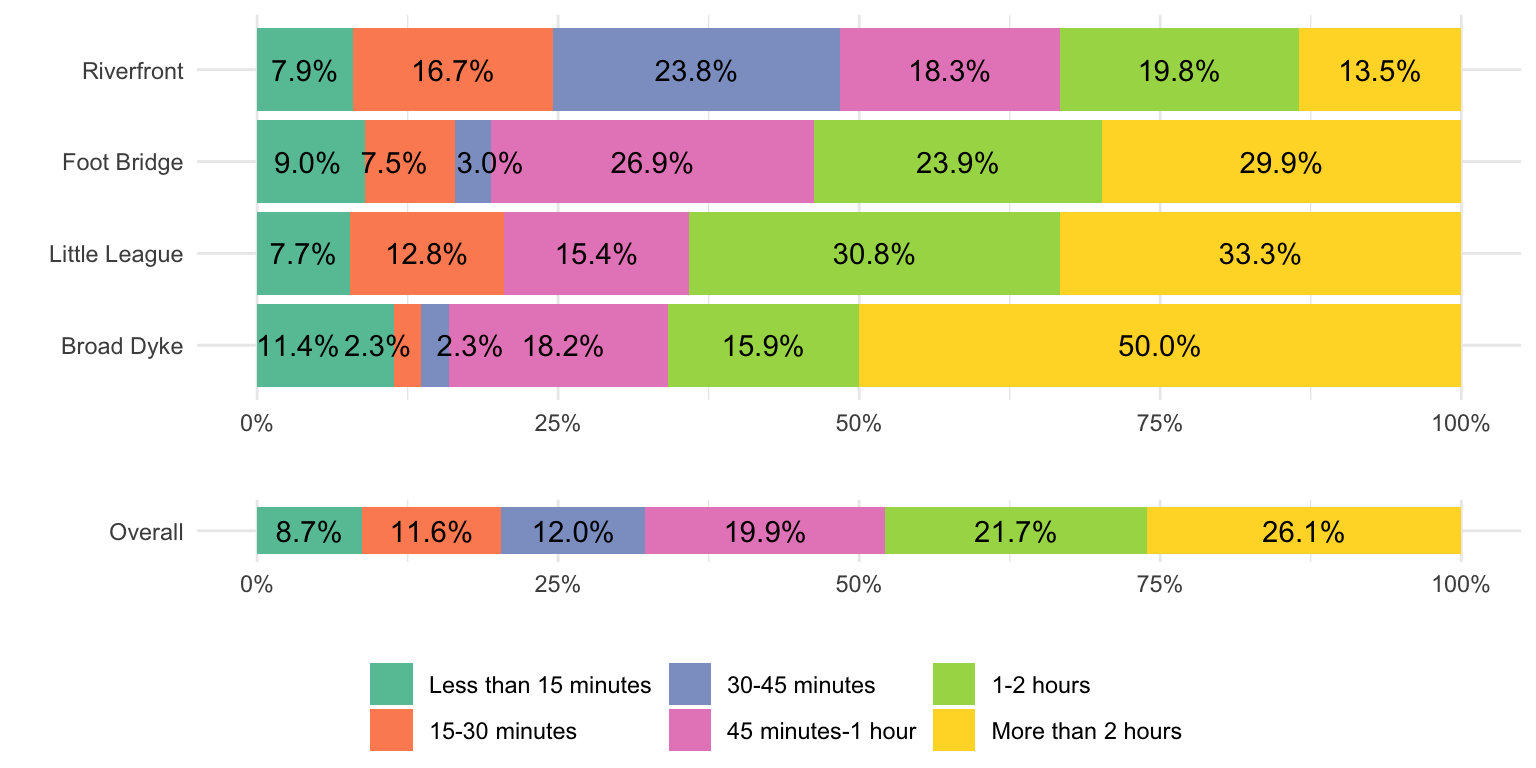
Figure 8: Total amount of time spent in the trail during a typical week. Participants at the Broad Dyke location were more likely to report spending more than 2 hours a week in the trail, compared with those at other locations. (Details)
Sentimates about the trail
Trail users like the Foot Bridge and Broad Dyke areas the most
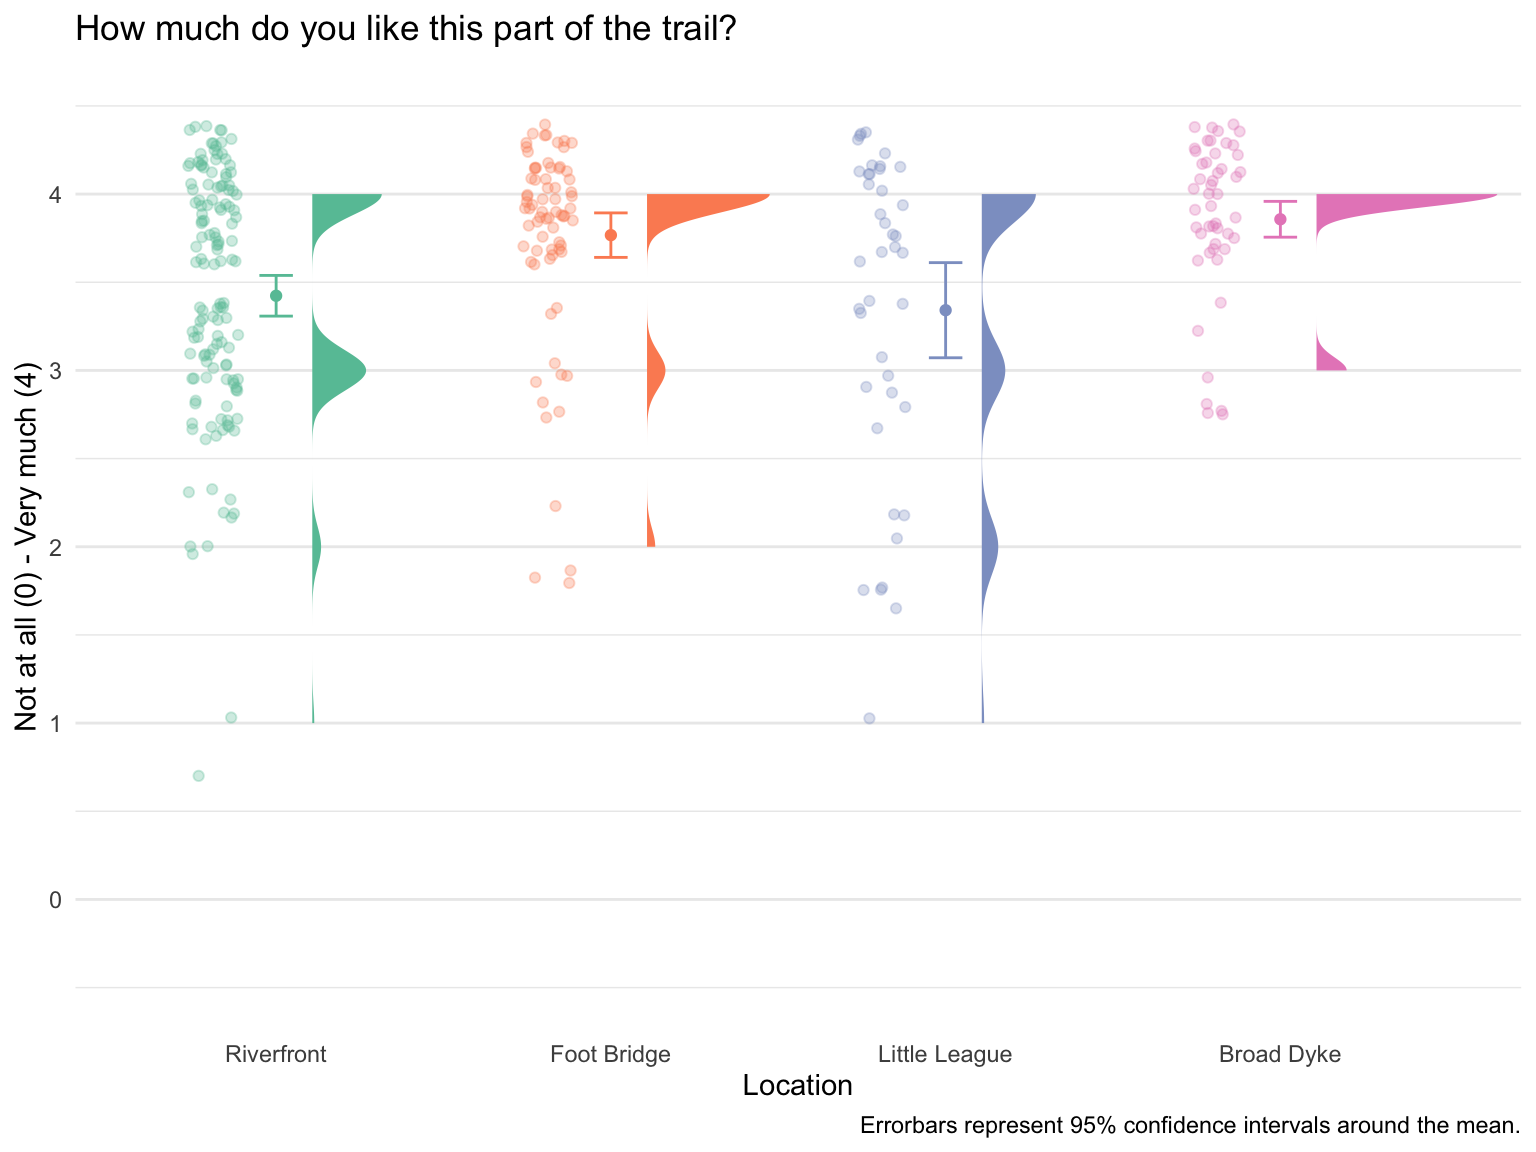
Figure 9: Liking across Locations (Details)
Trail users see the Foot Bridge area as well-maintained
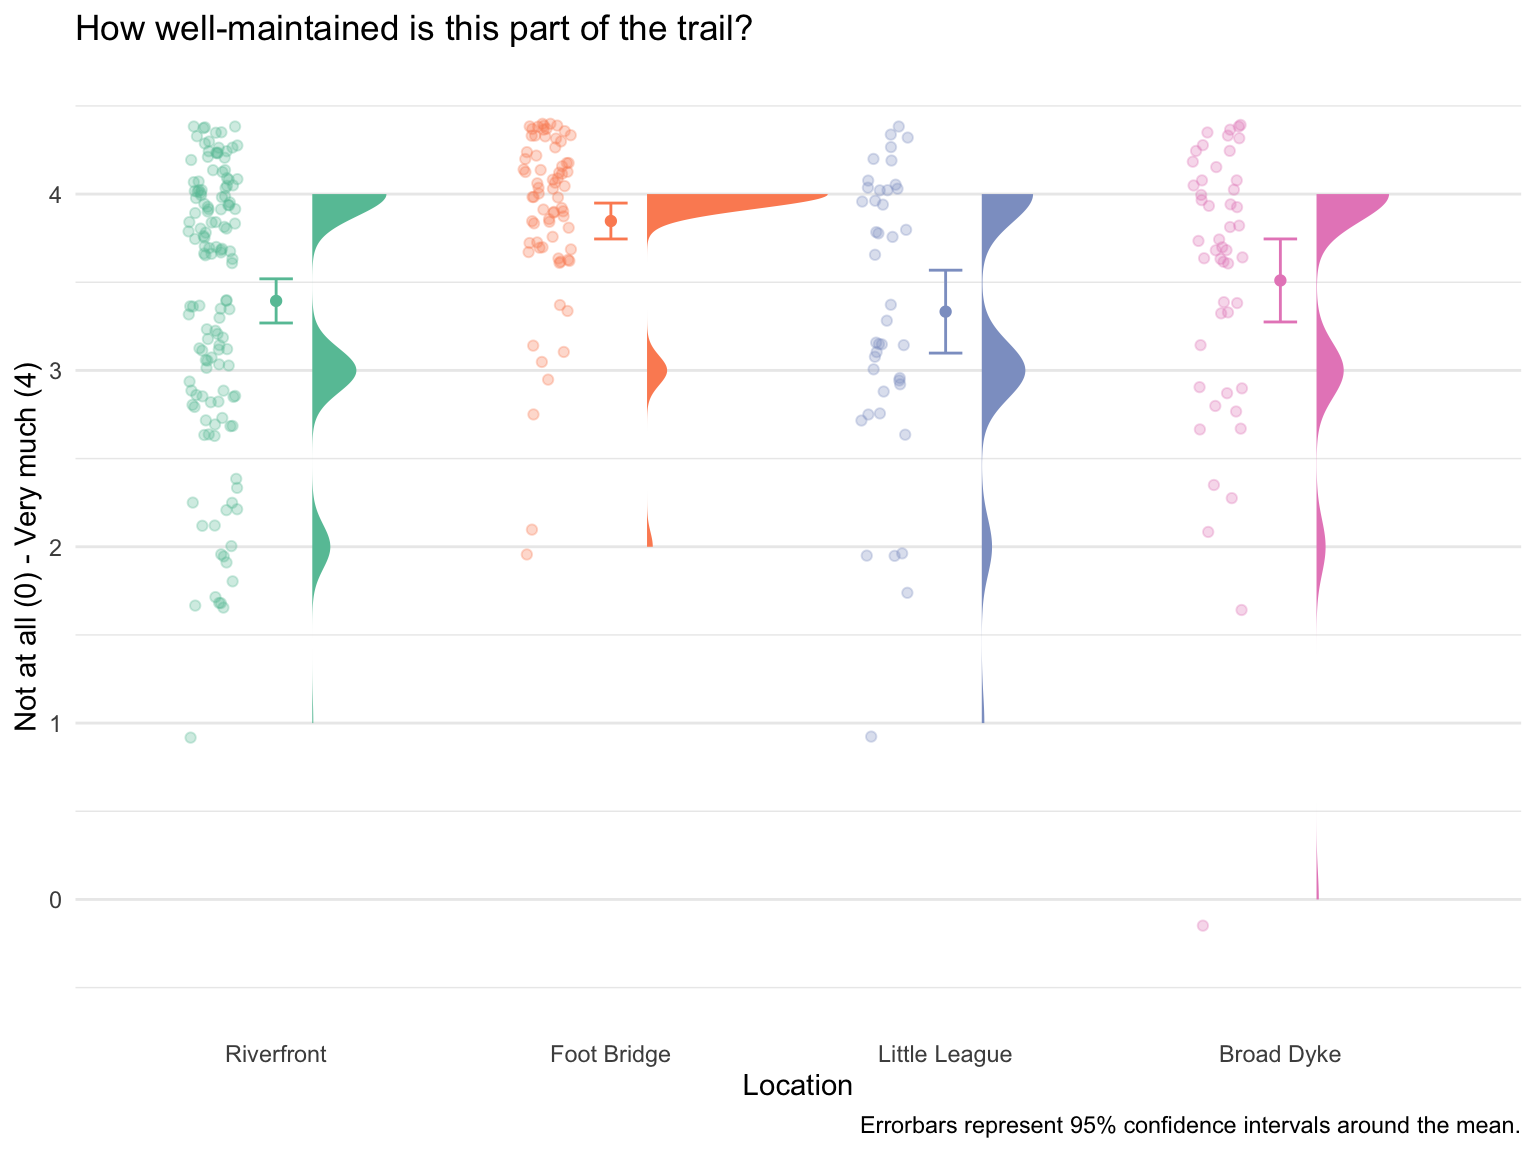
Figure 10: Maintenance Indices Across Locations. (Details)
The Riverfront, the Foot Bridge, and the Broad Dyke areas are people’s favorite locations
Figure 11: Favorite locations (Details)
When asked about improvements, people mention about bathrooms
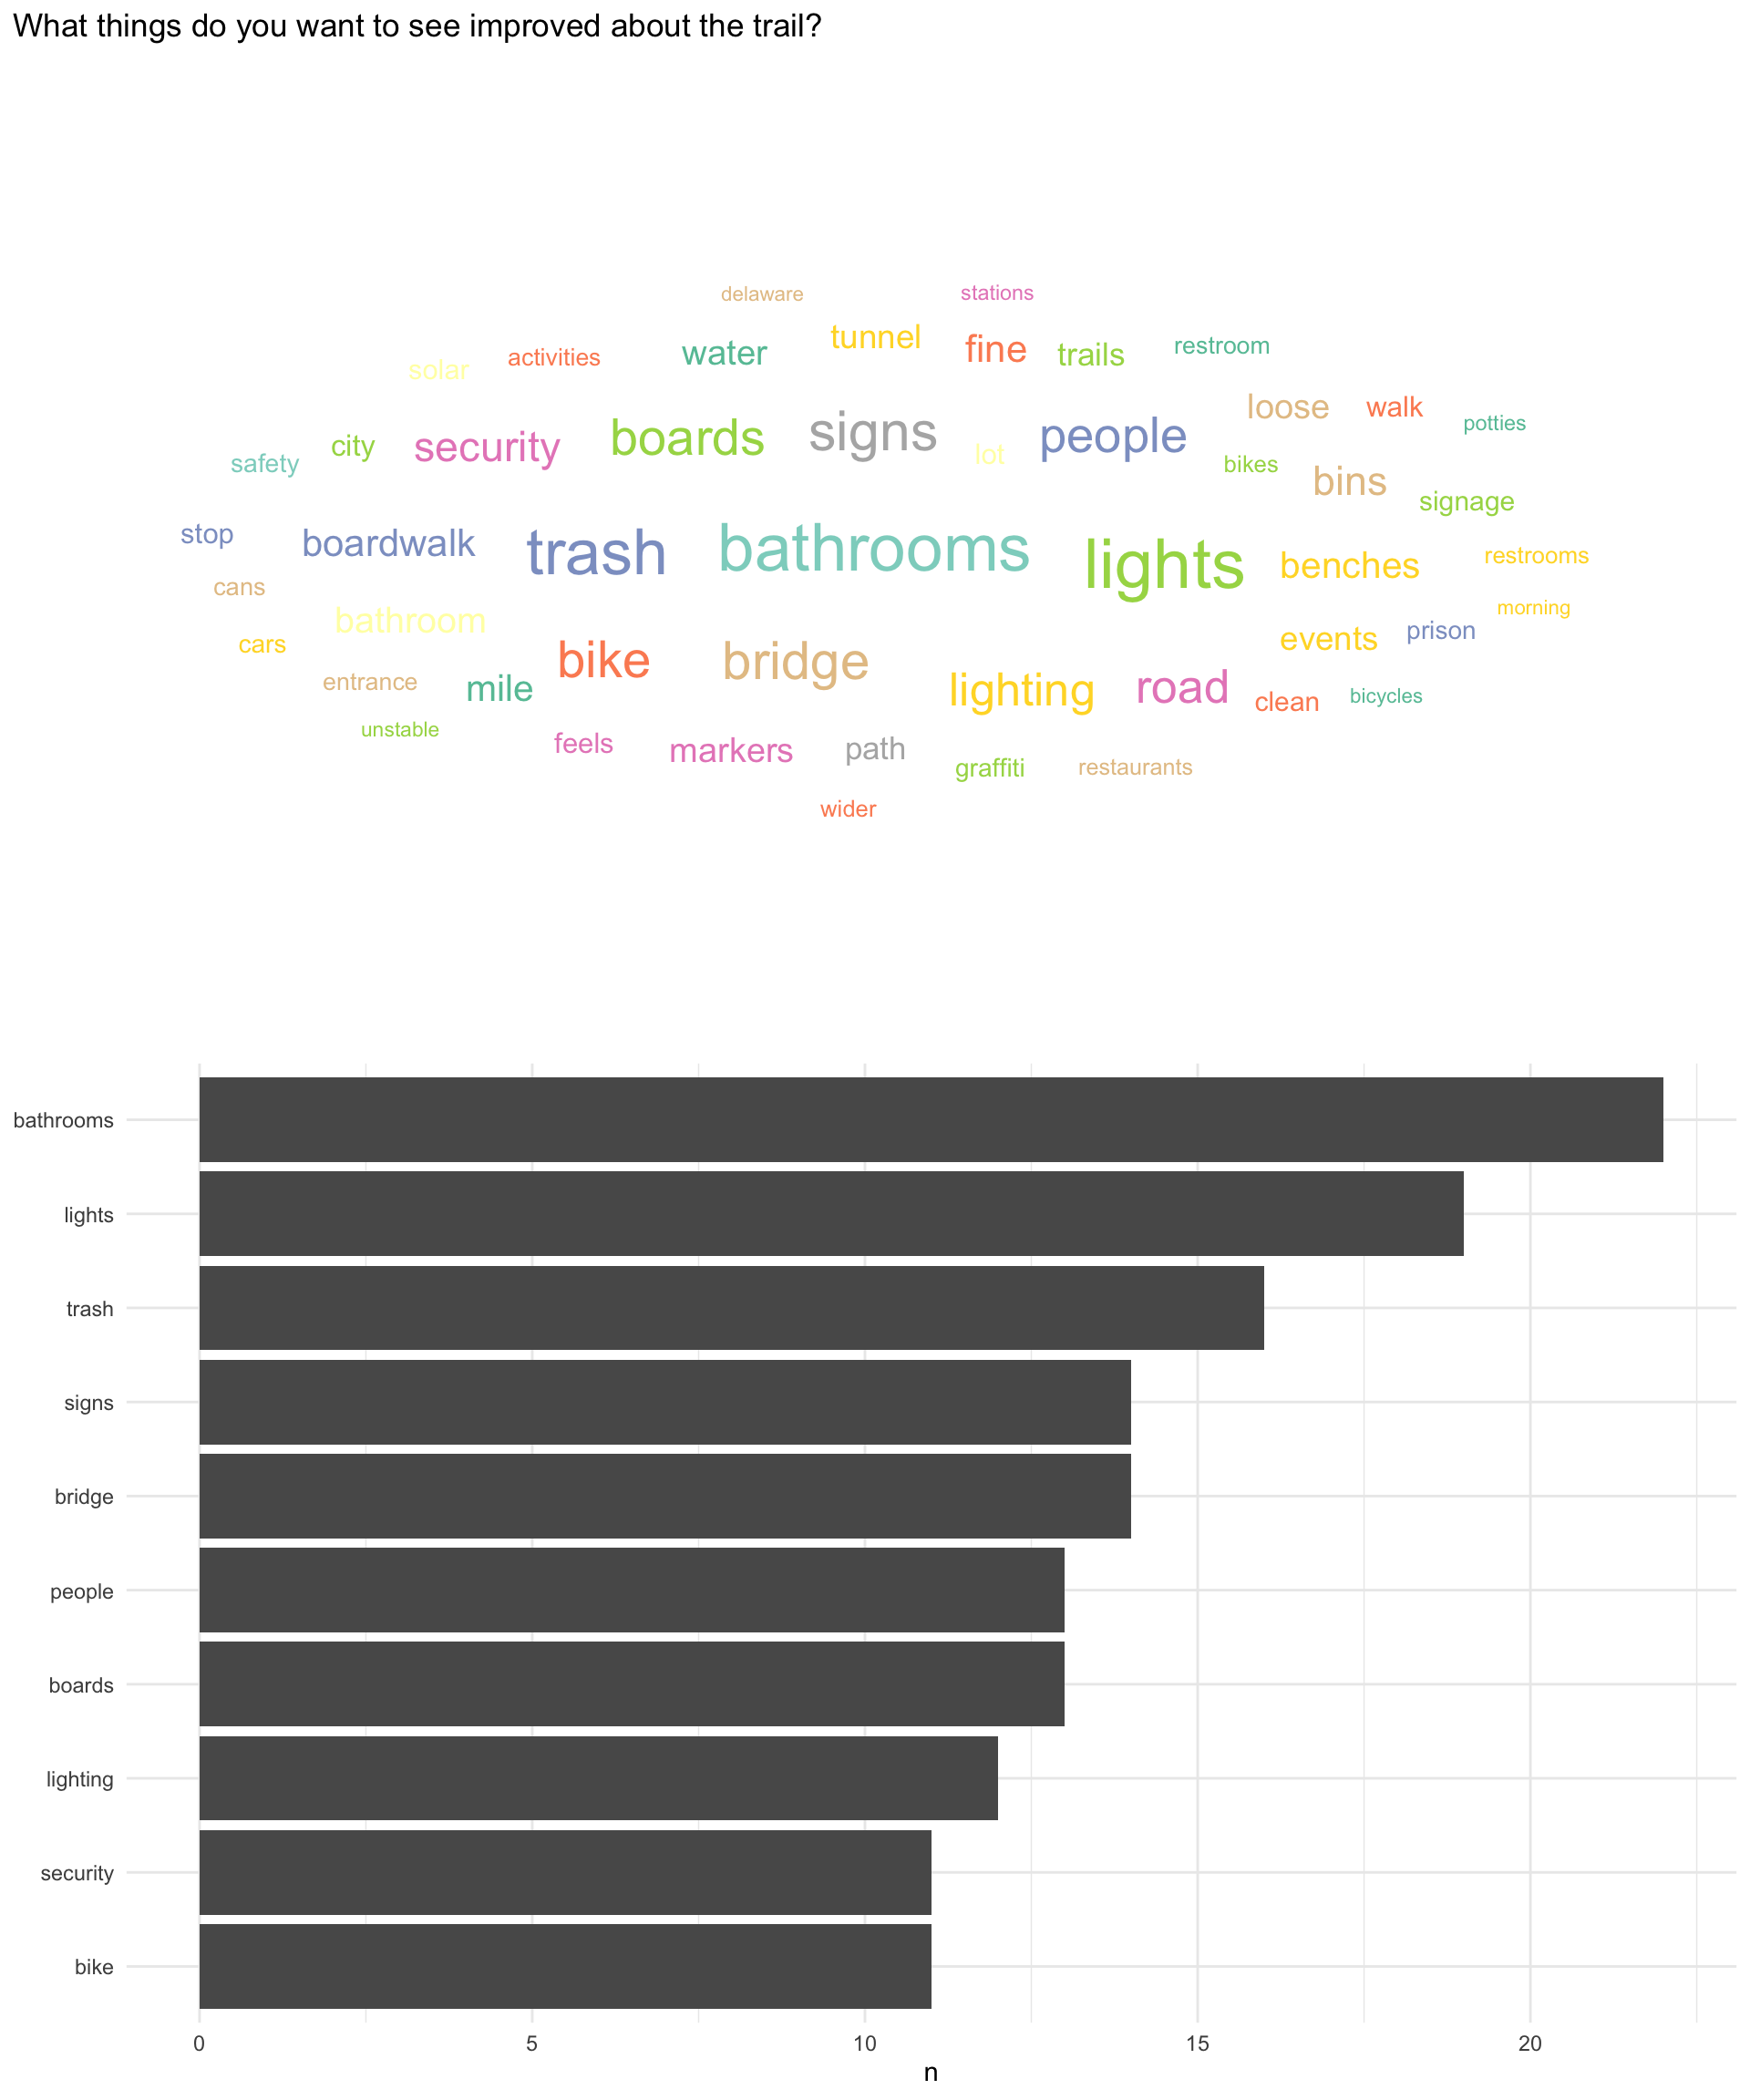
Figure 12: Word cloud for improvements that people want to see for the trail (Detail)