Detailed Findings
Traveling to the trail
Most people drive to the trail
Overall, most participants came to trail by car (53.27%), followed by on foot (29.08%), by bike (14.71%), and by public transportation (2.61%; see Figure 13). The Riverfront location was the only location where we had participants who used public transportation.
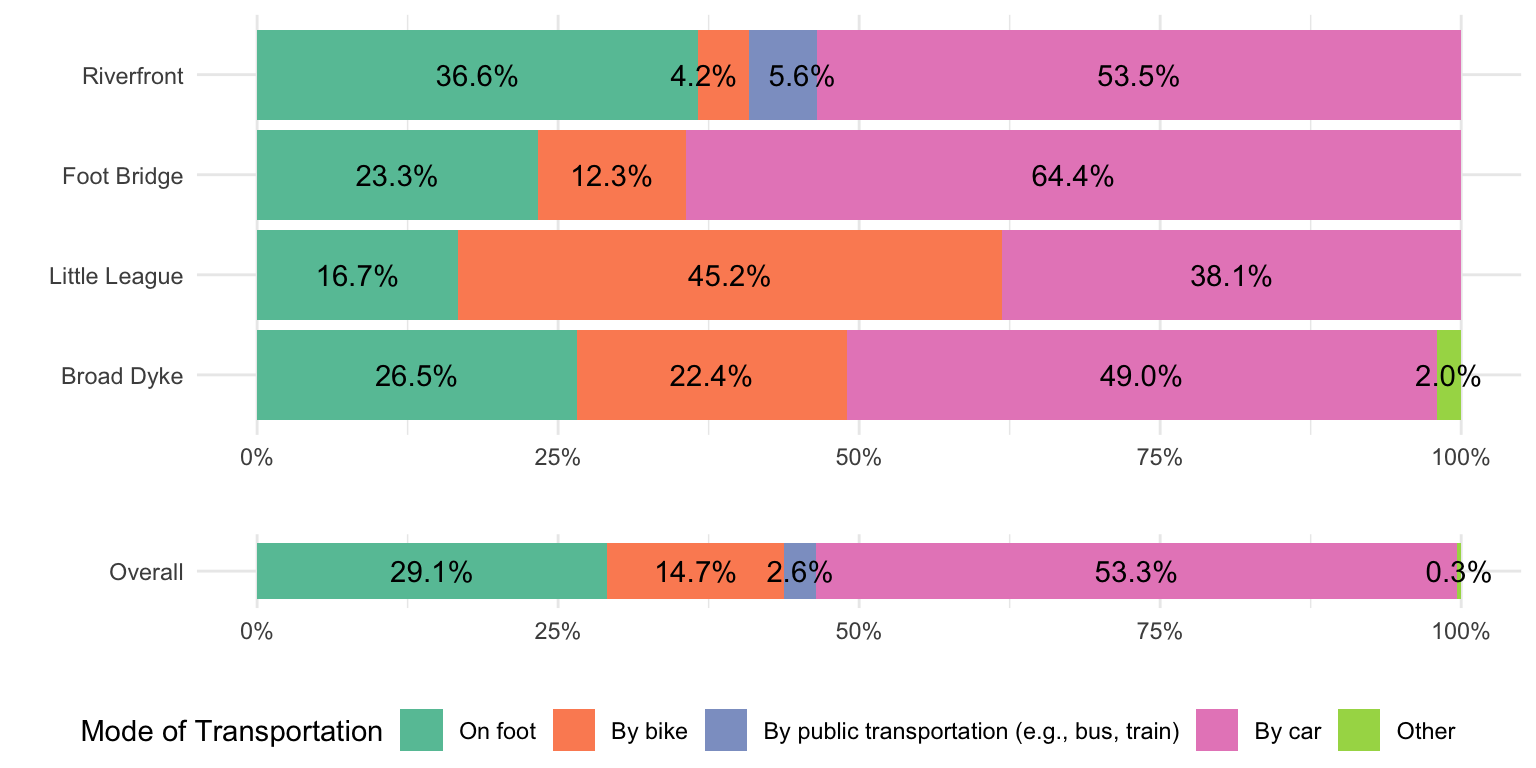
Figure 13: How trails users are getting to the trail
To examine whether people came to the trail by different means of transportation, we ran a chi-square test. We found that participants used different transportation methods depending on their locations surveyed (\(\chi^2\)(12, N = 306) = 63.62, p < .001). Participants at the Riverfront location were less likely to use bikes to access the trail, compared with other locations (residual = -4.82, p < .001). Participants at the Little League location were more likely to use bikes, compared with other locations (residual = 6.02, p < .001).
Most people enter and exit at the same place
Most participants (88.89%) reported that they enter and exit from the same point at the trail. Only a small group of participants (8.17%) reported that they enter and exit from different locations. To examine whether the proportions of people entering and exiting at the same place vs. different places, we ran a chi-square test. We did not find differences in proportions across the locations (\(\chi^2\)(3, N = 297) = 1.02, p = .797; see Figure 14).
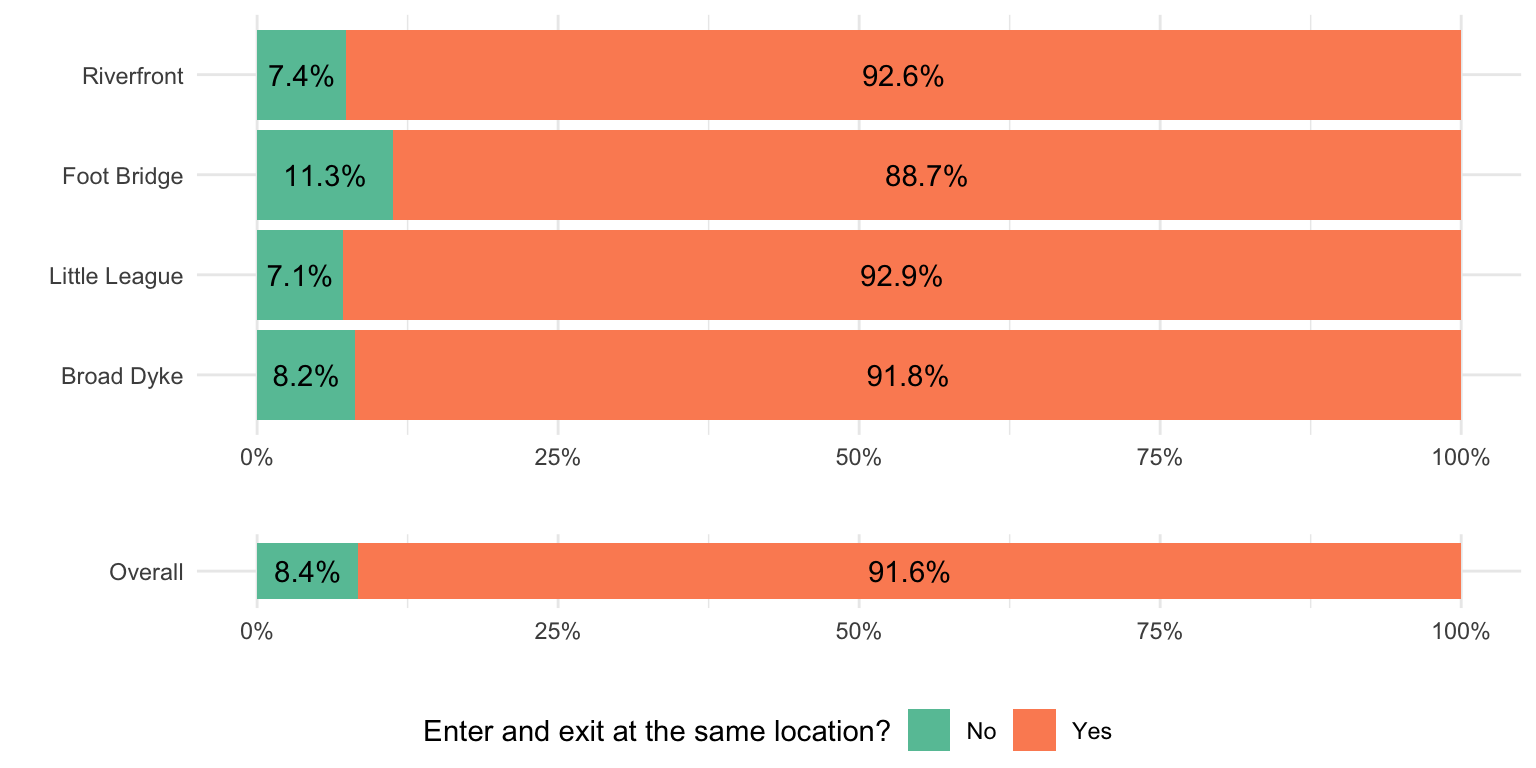
Figure 14: Entering and exiting at the same location
Most people spend less than 30 minutes to get to the trail
Most participants reported that they spent less than 30 minutes to get to the trail (less than 15 minutes: 48.34%; 15-29 minutes: 38.41%). We also found that participants reported different traveling times across locations (\(\chi^2\)(6, N = 302) = 15.76, p = .015). Participants at the Broad Dyke location were more likely to report spending less than 15 minutes to get to the trail compared with other locations (residual = 2.91, p = .044).

Figure 15: Travel time to the trail
Trail Use
Most people come to the trail to exercise
Most participants reported that they came to the trail to exercise (77.45%). Participants also reported that they came to the trail to relax or unwind (31.37%) or to socialize with friends or family (18.95%). The percentages do not sum up to 100% since participants could select multiple purposes See Figure 16 for the summary of the results. These results suggest that the most common purpose of using the trail is to exercise.
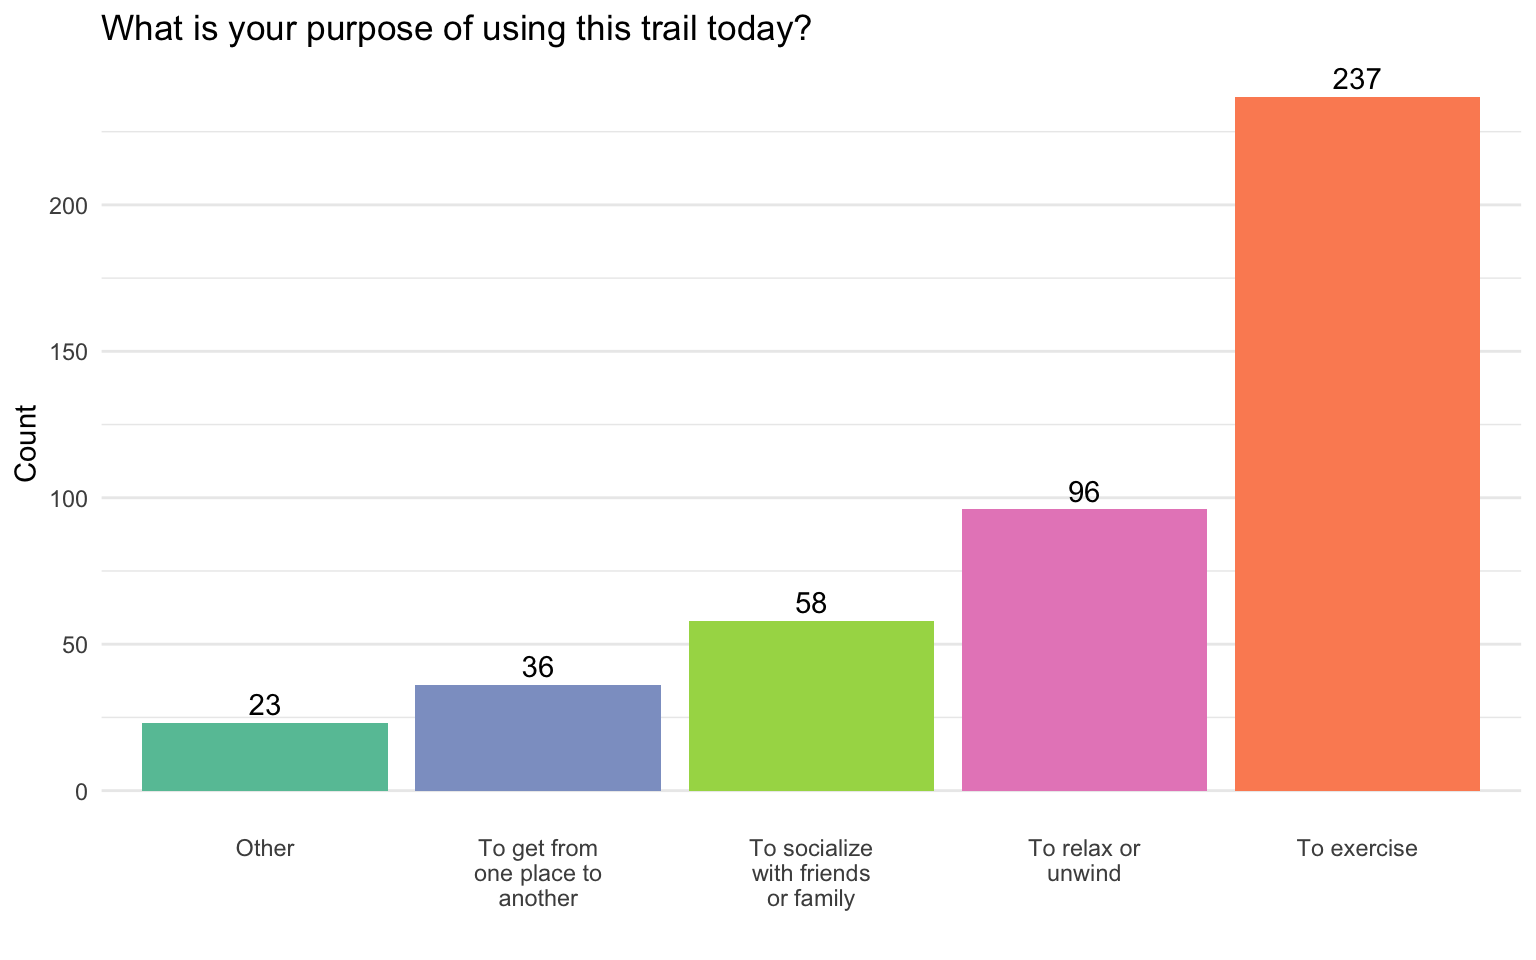
Figure 16: Purpose of using the trail
The most popular activity was walking, followed by biking and running
The most popular activity at the trail was walking (66.99%), followed by biking (26.8), and running (15.69%). The percentages do not sum up to 100% since participants could answer engaging in multiple activities at the same time. See Figure 17 for the summary. These results suggest that the most popular activity may be walking. More trail users may be biking than running.
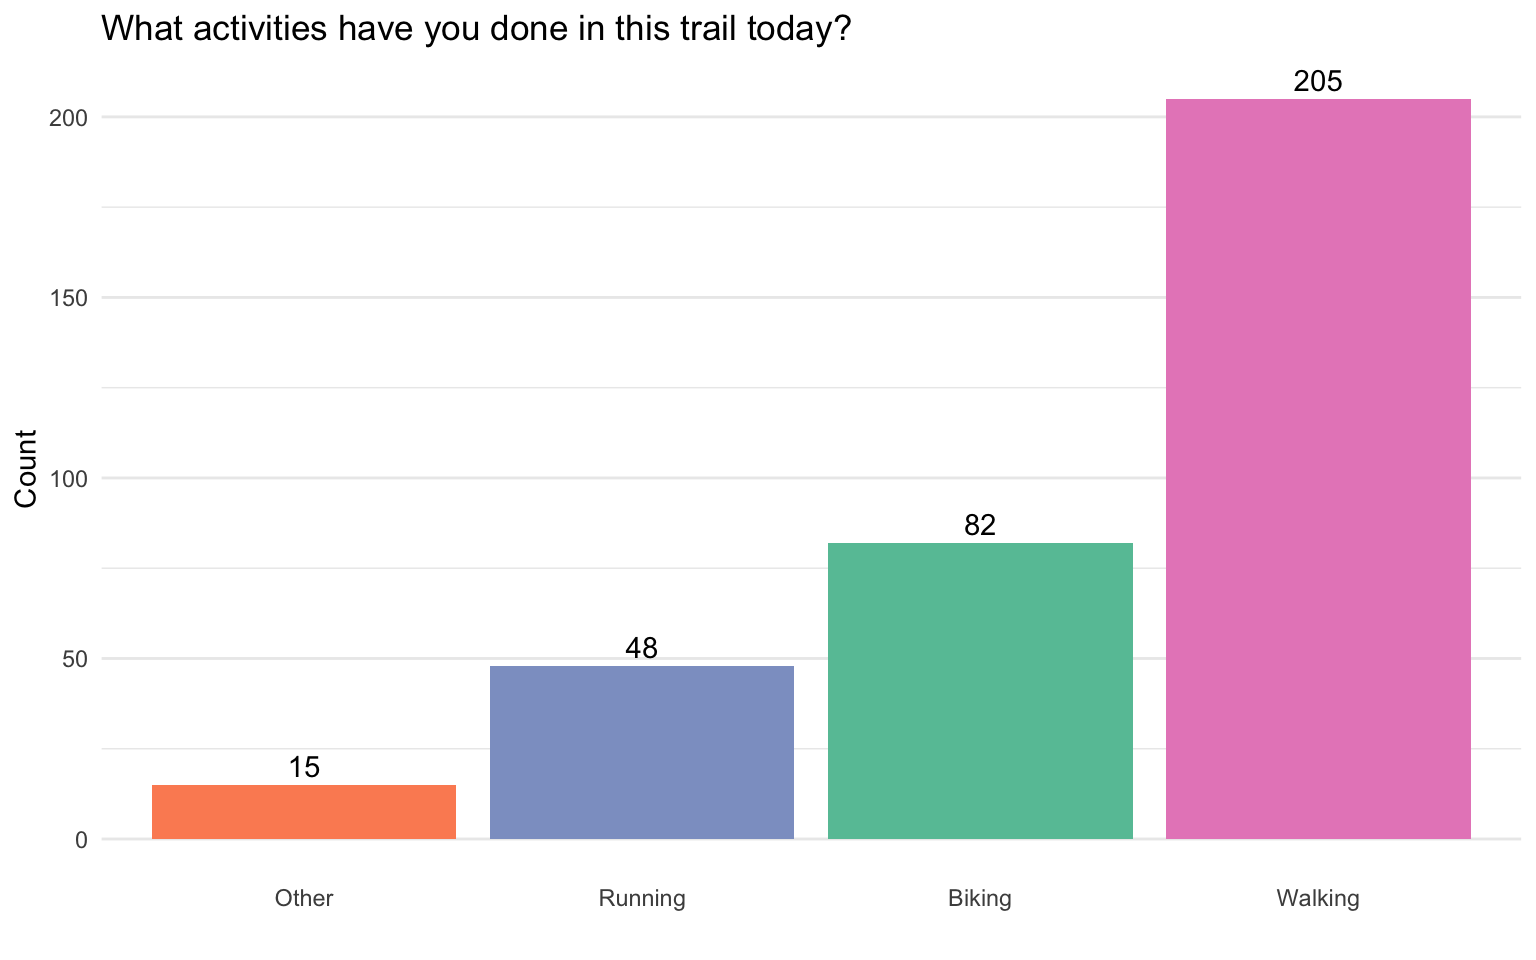
Figure 17: Type of Activity
Many trail users visit the trail at least once a week
We found that the majority of participants reported visiting the trail at least once a week (9.12% visiting every day, 32.48% several times a week, and 17.88% once a week). We also found that participants reported different levels of frequency of trail use across survey locations (\(\chi^2\)(18, N = 274) = 33.00, p = .017). In a post-hoc test, we found that participants at the Riverfront location were more likely to report that they use the trail once a year or less frequently than those at the other locations (residual = 3.17, p = .042). See Figure 18 for the summary.
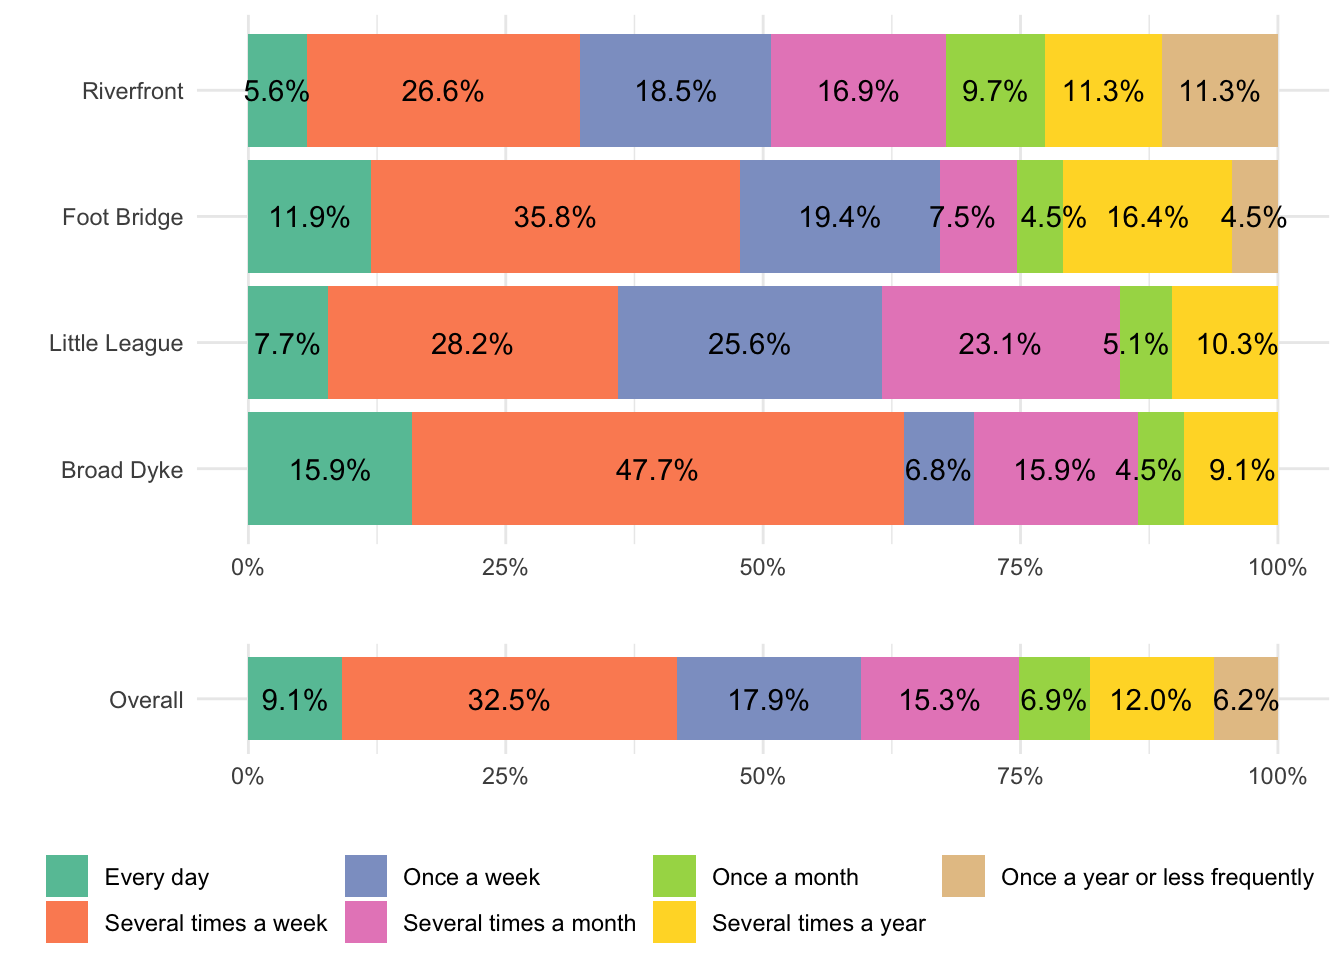
Figure 18: Frequency of visit
The majority of trail users spend 45 minutes in a week in the trail—users at the south part tend to spend more time
We had 27 (8.91%) participants who visited the trail for the first time. Most people have visited the trail before (n = 276; 91.09%). Among those who visited the trail before, we asked how much time they spend in the trail in a typical week. Figure 19. We also found that participants across survey locations reported spending a different amount of time in a typical week (\(\chi^2\)(15, N = 303) = 59.72, p < .001). Participants at the Broad Dyke location were more likely to report that they spend more than 2 hours a week in the trail, compared with those at other locations (residual = 3.72, p = .005). These results suggest that trail users visiting the south part of the trail (e.g., Broad Dyke) tend to spend more time in the trail, compared with the north part of the trail (e.g., Riverfront).
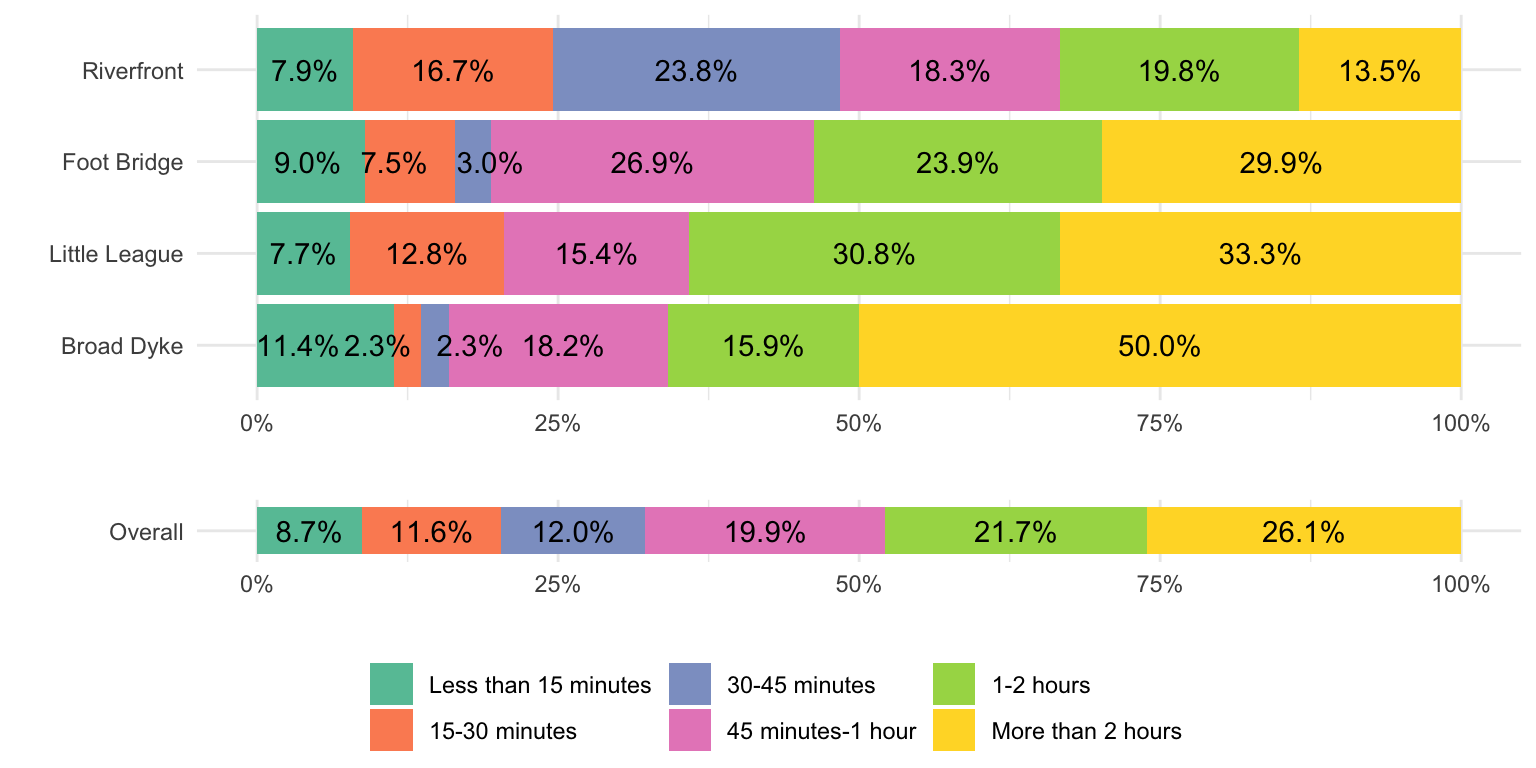
Figure 19: Total amount of time spent in the trail during a typical week
Sentimates
Trail users favor the Foot Bridge area the most
Across the survey locations, the majority of participants (64.05%) reported that they very much liked the part of the trail. Similarly, the majority of participants (66.34%) reported that the part of the trail meets their needs. These results suggest that trail users generally like the trail, and that the trail satisfies their needs.
Next, we performed a one-way ANOVA to examine if participants reported different levels of liking across the locations. We found that participants reported different levels of liking across locations (F(3, 296) = 9.86, p < .001). Post-hoc tests suggested that participants at the Foot Bridge reported higher liking compared with those at the Riverfront location (t = -3.73, p = .001) or those at the Little League location (t = 3.43, p = .004). Participants at the Broad Dyke location reported higher liking than those at the Riverfront location (t = -4.10, p < .001) or those at the Little League location (t = -3.83, p < .001). Participants reported similar levels of liking between the Foot Bridge and Broad Dyke locations (t = -0.77, p = .869), and between the Riverfront and the Little League locations (t = 0.72, p = .888). These results suggest that trail users like the Foot Bridge and the Broad Dyke locations more than the Riverfront and the Little League locations.
We also performed a one-way ANOVA to examine if participants reported different levels of need satisfaction across locations. We found that participants reported different levels of need satisfaction across locations (F(3, 297) = 3.61, p = .014). However, post-hoc tests suggested that the need satisfaction scores were similar across the locations (p > .05). These results suggest that all locations equally meet trail users’ needs.
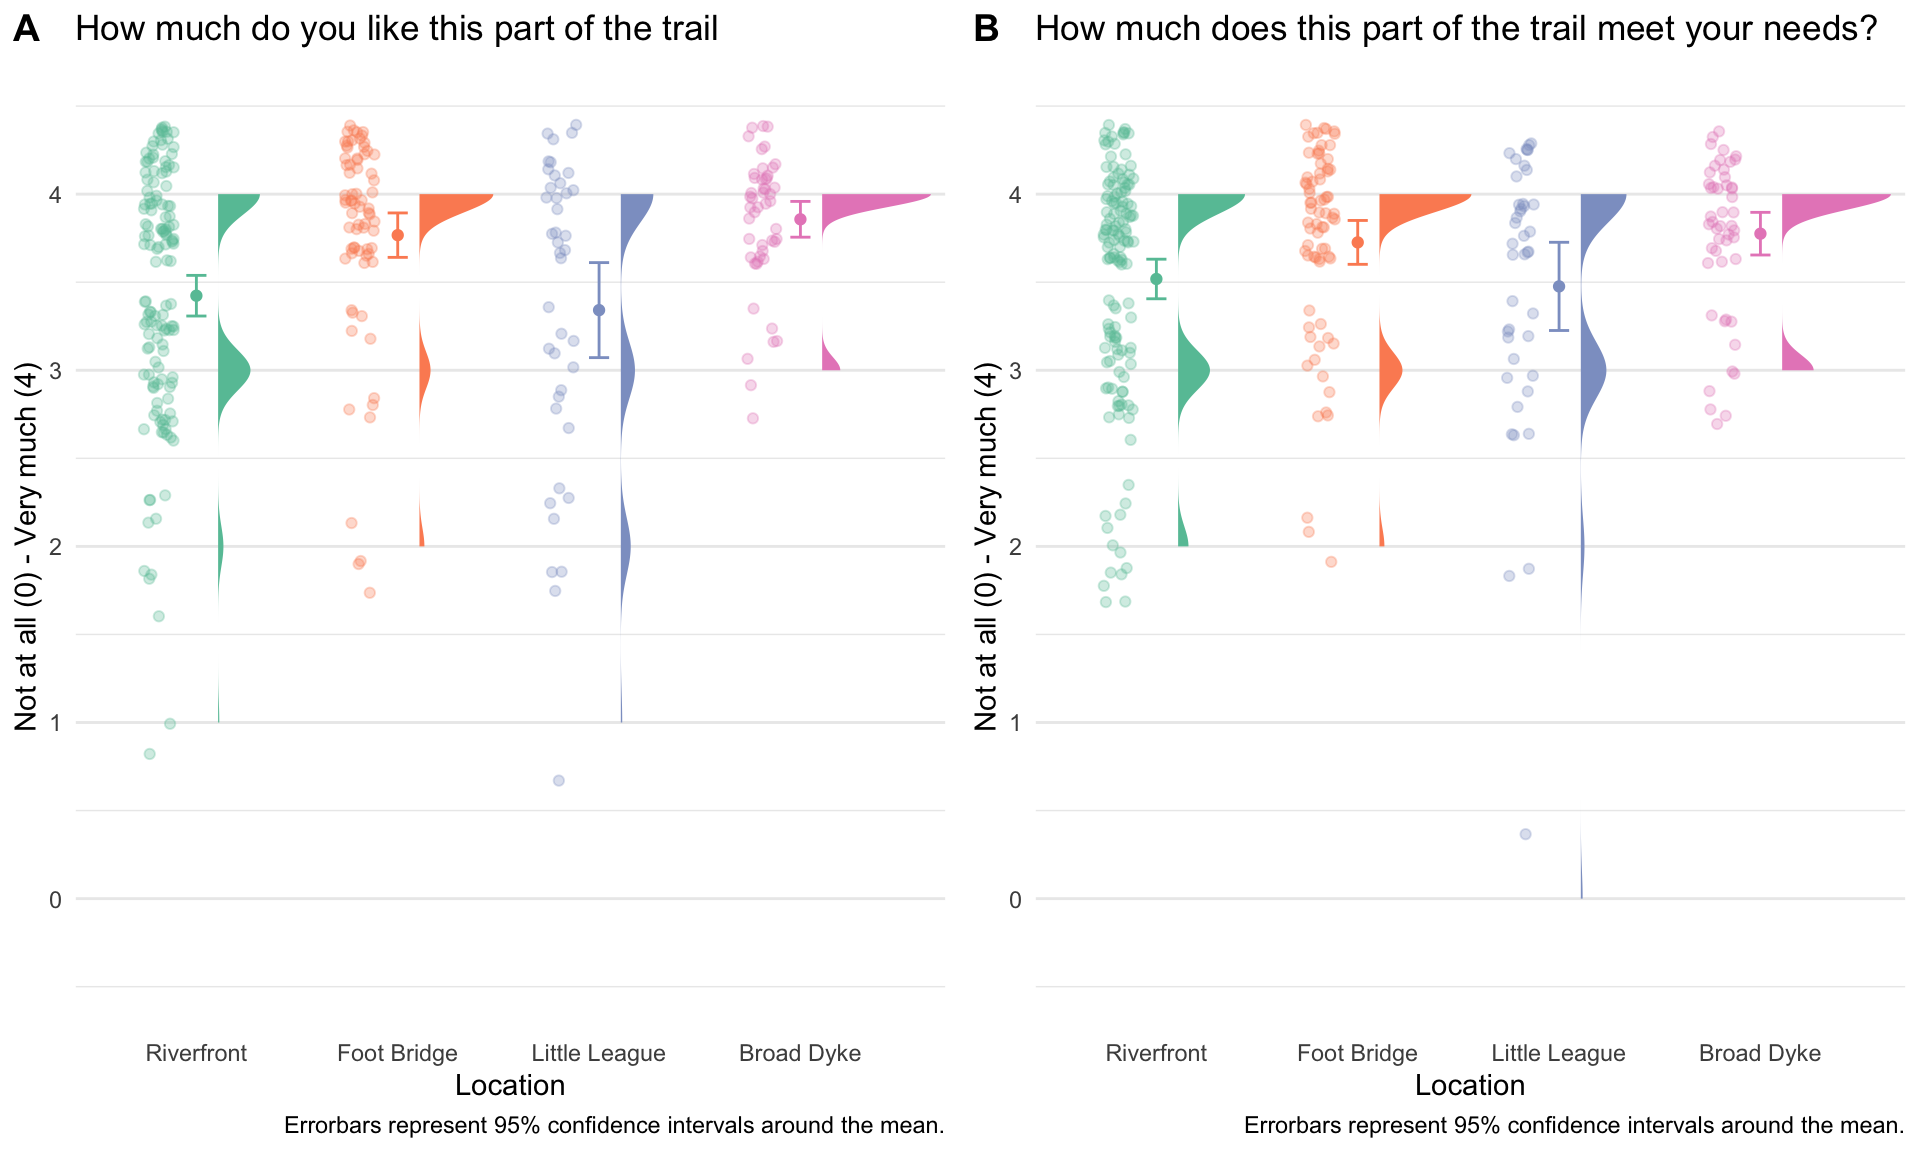
Figure 20: Liking and Need Satisfaction across Locations
Trail users see the Foot Bridge area as well-maintained
Overall, the majority of participants reported that the trail was very well-maintained (61.76%; M = 3.51, SD = 0.72). Majority of participants were very satisfied with the general condition of the trail (63.4%; M = 3.58, SD = 0.65) and the availability of trash bins (54.25%; M = 3.27, SD = 1.03). However, participants were less satisfied with the availability of programs, events, and activities (only 40.2% answering “very satisfied”; M = 2.83, SD = 1.29), and amenities such as benches, bike racks, and bike repair stations (only 45.75% answering “very satisfied”; M = 3.05, SD = 1.12). These results suggest that trail users are satisfied with the general upkeeping of the trail, while they are less satisfied with availability of programs and amenities.
Next, we examined whether participants reported different levels of maintenance and satisfaction across the locations. We performed one-way ANOVAs on each outcome variable. For the perception of the maintenance, we found that participants reported different levels of perceived maintenance across the locations (F(3, 296) = 7.79, p < .001; see Figure 21). Post-hoc analyses suggested that participants at the Foot Bridge location reported higher perceived maintenance compared with those at the Riverfront (t = -4.47, p < .001), the Little League (t = 3.80, p = .001), and the Broad Dyke locations (t = 2.61, p = .046). The other three locations did not differ in perceived maintenance (p > 0.05). These results suggest that trail users see the Foot Bridge location as the most well-maintained among the four survey locations.
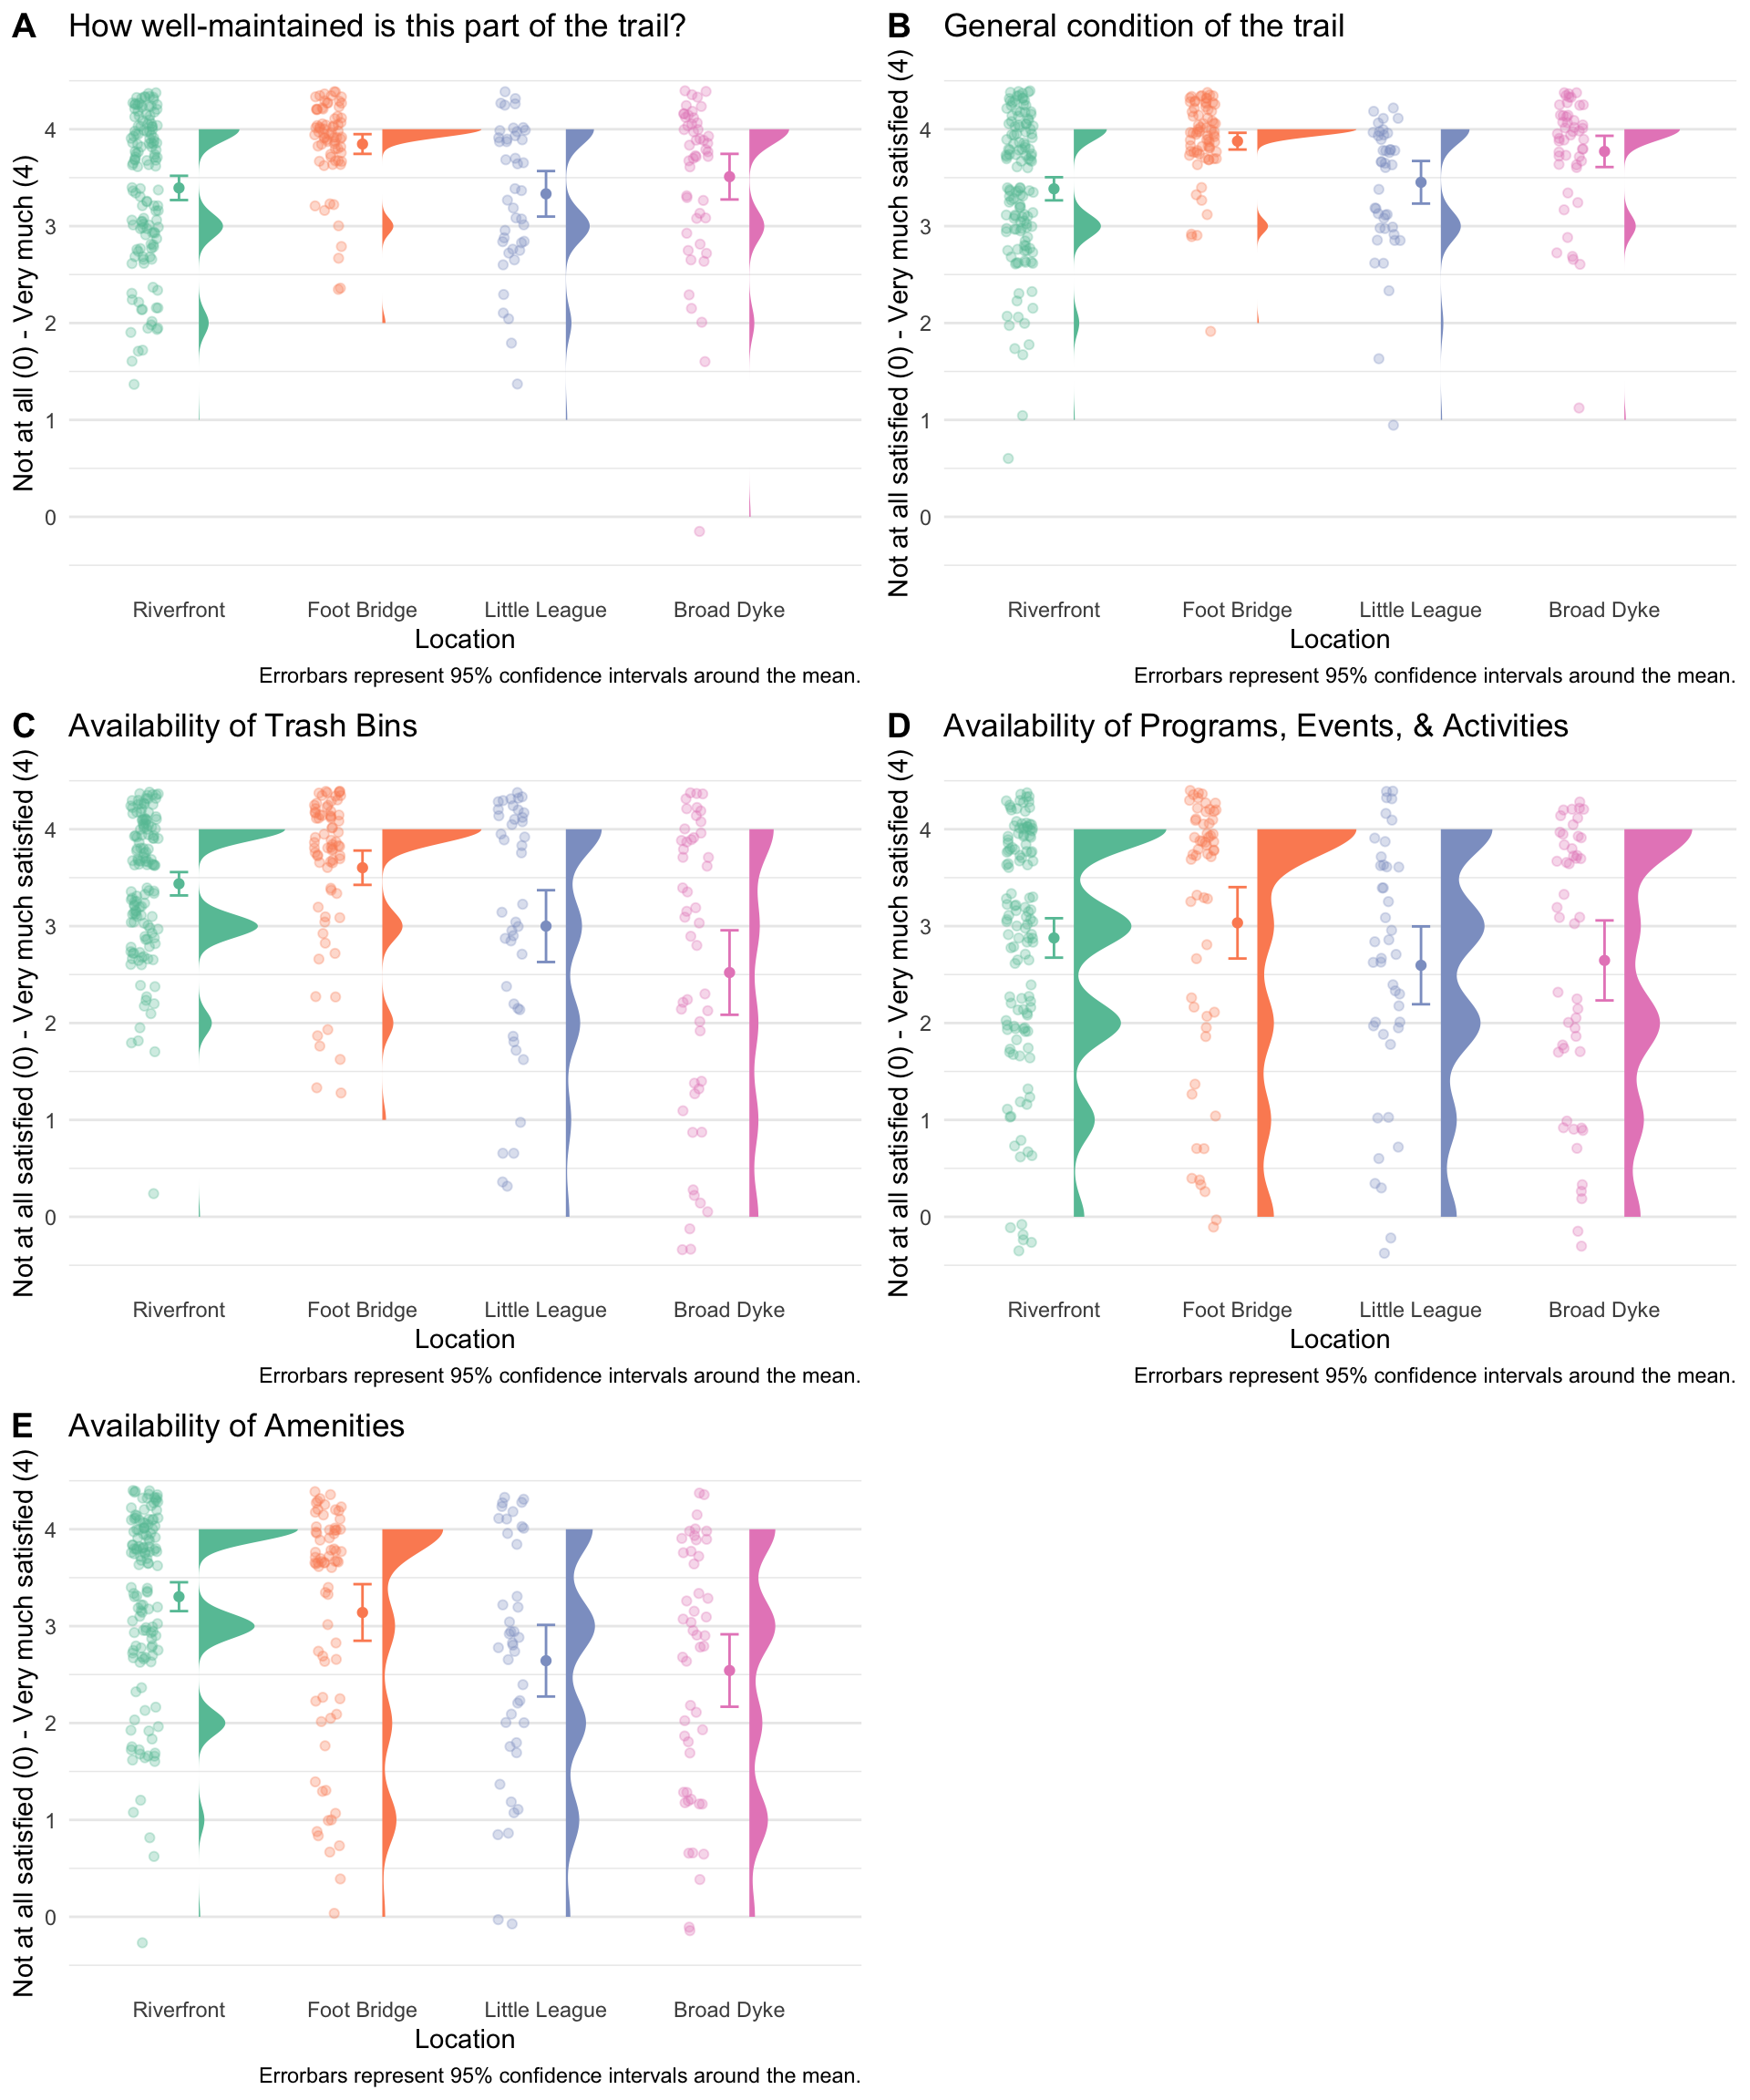
Figure 21: Maintenance Indices Across Locations
We found that participants reported different levels of satisfaction for the general condition of the trail across survey locations (F(3, 294) = 12.37, p < .001). Post-hoc analyses suggested that participants at the Foot Bridge location were more satisfied with the trail condition than those at the Riverfront (t = -5.51, p < .001) and the Little League locations (t = 3.57, p = .002). Participants at the Broad Dyke location reported higher satisfaction than those at the Riverfront location (t = -3.74, p = .001). Participants reported similar levels of satisfaction between the Foot Bridge and Broad Dyke locations (t = 0.93, p = .790), and between the Riverfront and the Little League locations (t = -0.62, p = .926). These results suggest that trail users are more satisfied with the general condition of the Foot Bridge and the Broad Dyke locations than the Riverfront and the Little League locations.
For the question about the availability of trash bins, we again found that participants reported different levels of satisfaction across the survey locations (F(3, 294) = 15.04, p < .001). Post-hoc analyses suggested that the participants at the Foot Bridge location were more satisfied with the availability of trash bins than those at the Little League (t = 3.23, p = .007) and Broad Dyke (t = 6.05, p < .001) locations. Participants at the Riverfront locations reported higher satisfaction than those at the Broad Dyke location (t = 5.66, p < .001). Participants reported similar levels of satisfaction between the Foot Bridge and Riverfront locations (t = -1.18, p = .637), between the Riverfront and the Little League locations (t = 2.57, p = .052), and between the Little League and the Broad Dyke locations (t = 2.35, p = .088). These results suggest that trail users at the Riverfront and the Foot Bridge locations are more satisfied with the availability of trash bins, compared with those at the Little League and the Broad Dyke locations.
For the question about the availability of programs, events, and activities, we found that participants reported similar levels of satisfaction across locations (F(3, 276) = 1.34, p = .261). We suggest that these null results are unsurprising since these questions referred to programs offered at the trail as a whole, regardless of specific locations.
For the question about the availability of amenities (e.g., benches, bike racks, bike repair stations), we found that participants reported different levels of satisfaction across the locations (F(3, 292) = 8.09, p < .001). Post-hoc analyses suggested that participants at the Riverfront were more satisfied with the amenities than those at the Little League location (t = 3.44, p = .004) and the Broad Dyke location (t = 4.17, p < .001). Participants at the Foot Bridge location reported higher satisfaction than those at the Broad Dyke location (t = 2.95, p = .018). Participants reported similar levels of satisfaction between the Riverfront and Foot Bridge locations (t = 1.02, p = .736), between the Foot Bridge and the Little League locations (t = 2.35, p = .088), and between the Little League and Broad Dyke locations (t = 0.44, p = .971). These results suggest that trail users at the Riverfront location are more satisfied about the availability of locations than those at the Little League or the Broad Dyke locations.
Trail users at the Foot Bridge feel taking advantage of resources the most
We ran a one-way ANOVA to examine whether participants reported different levels of taking advantage of the resources across the locations. Results suggested that participants felt that they were taking advantage of trail resources differently across the locations F(3, 297) = 5.27, p = .001. In the post-hoc tests, we found that participants at the Foot Bridge locations reported that they were taking advantage more than those at the Riverfront location (t = -3.84, p < .001) and the Little League location (t = 2.75, p = .032). Participants at the Riverfront, Little League, and Broad Dyke did not differ in their feeling of taking advantage of resources (p > .05). See Figure 22 for the summary. These results suggest that trail users at the Foot Bridge locations tend to feel that they are taking advantage of the resources more than other locations.
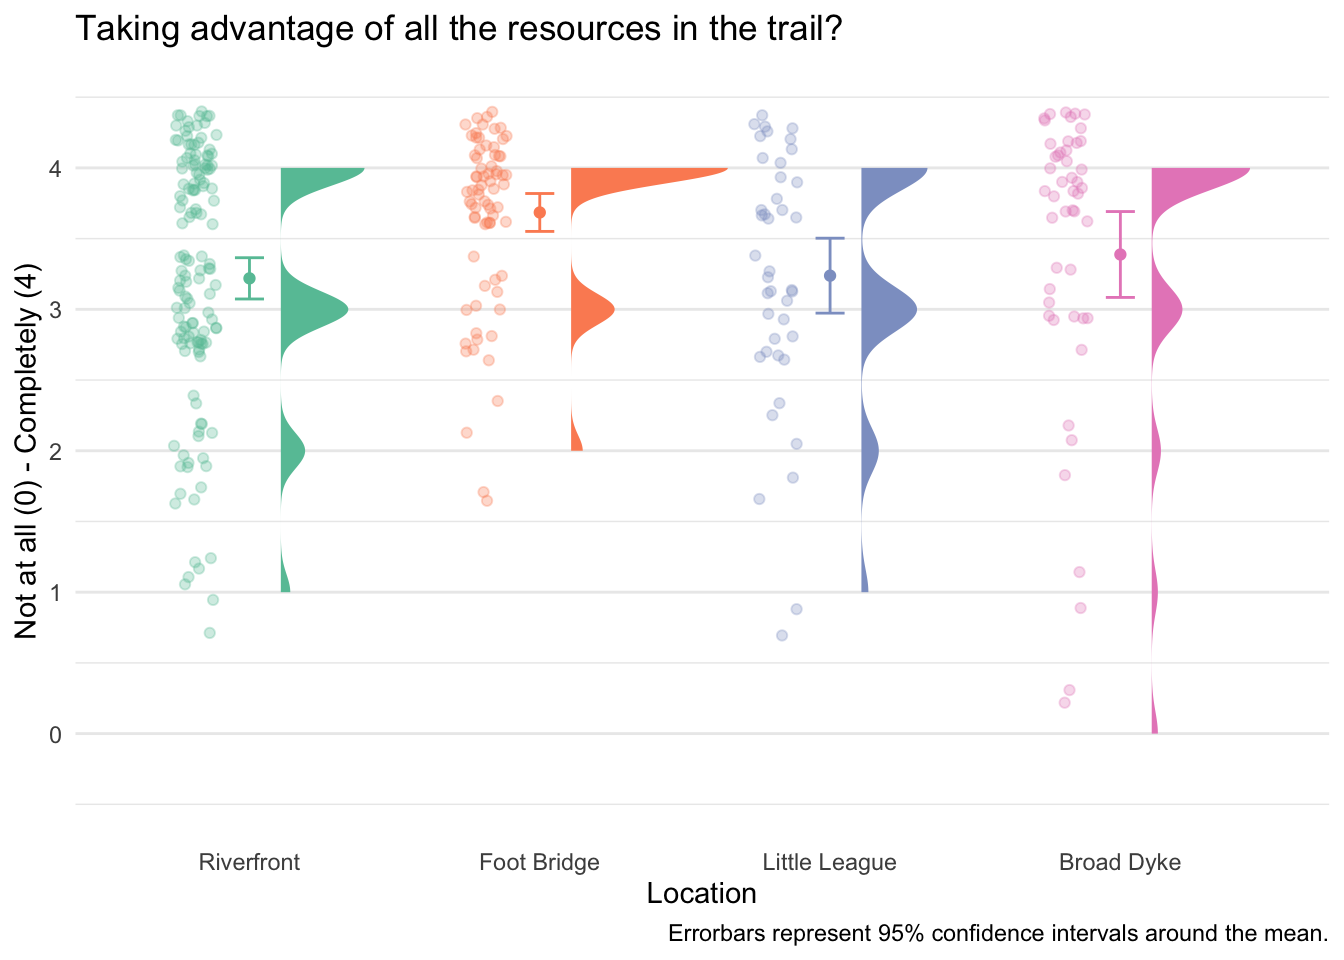
Figure 22: Feelings of Taking Advantage of Trail Resources
Trails users at the Foot Bridge location are most satisfied with the signage
Across locations, majority of participants reported that they were very much satisfied with the placement of the signs (52.94%; M = 3.36, SD = 0.84) and the information on the signs (M = 3.35, SD = 0.87). In contrast, less than the majority of participants reported that they were very much satisfied with the number of the signs (48.04%; M = 3.21, SD = 0.94).
To examine whether participants reported different levels of satisfaction about the signages, we performed one-way ANOVAs. For the placement of signs, we found that participants reported different satisfaction levels across locations (F(3, 288) = 5.65, p < .001; see Figure 23 A). In post-hoc tests, we found that participants at the Foot Bridge location were more satisfied with sign placement than those at the Riverfront location (t = -3.81, p < .001) or those at the Broad Dyke location (t = 3.19, p = .008). Participants at the Riverfront, Little League, and the Broad Dyke locations reported similar levels of satisfaction (p > .5).
For the question on the number of the signs, we found that participants reported different levels of satisfaction across the locations (F(3, 287) = 10.75, p < .001; see Figure 23 B). In post-hoc tests, we found that participants at the Foot Bridge location were more satisfied with the number of signs than those at the Riverfront location (t = -4.41, p < .001) and the Broad Dyke location (t = 5.16, p < .001). Participants at the Little League location reported higher satisfaction than those at the Broad Dyke location (t = 2.96, p = .017).
For the question on the information fo the signs, we again found that participants reported different levels of satisfaction across the locations (F(3, 288) = 8.80, p < .001; see Figure 23 C). In post-hoc tests, we found that participants at the Foot Bridge location were more satisfied with the information on the signs than those at the Riverfront location (t = -3.92, p < .001) and those at the Broad Dyke location (t = 4.82, p < .001). Participants reported similar levels of satisfaction between the Foot Bridge and the Little League location (t = 2.04, p = .177), between the Riverfront and the Little League location (t = -0.96, p = .774), between the Riverfront and the Broad Dyke location (t = 1.95, p = .210), and between the Little League and the Broad Dyke location (t = 2.34, p = .092).
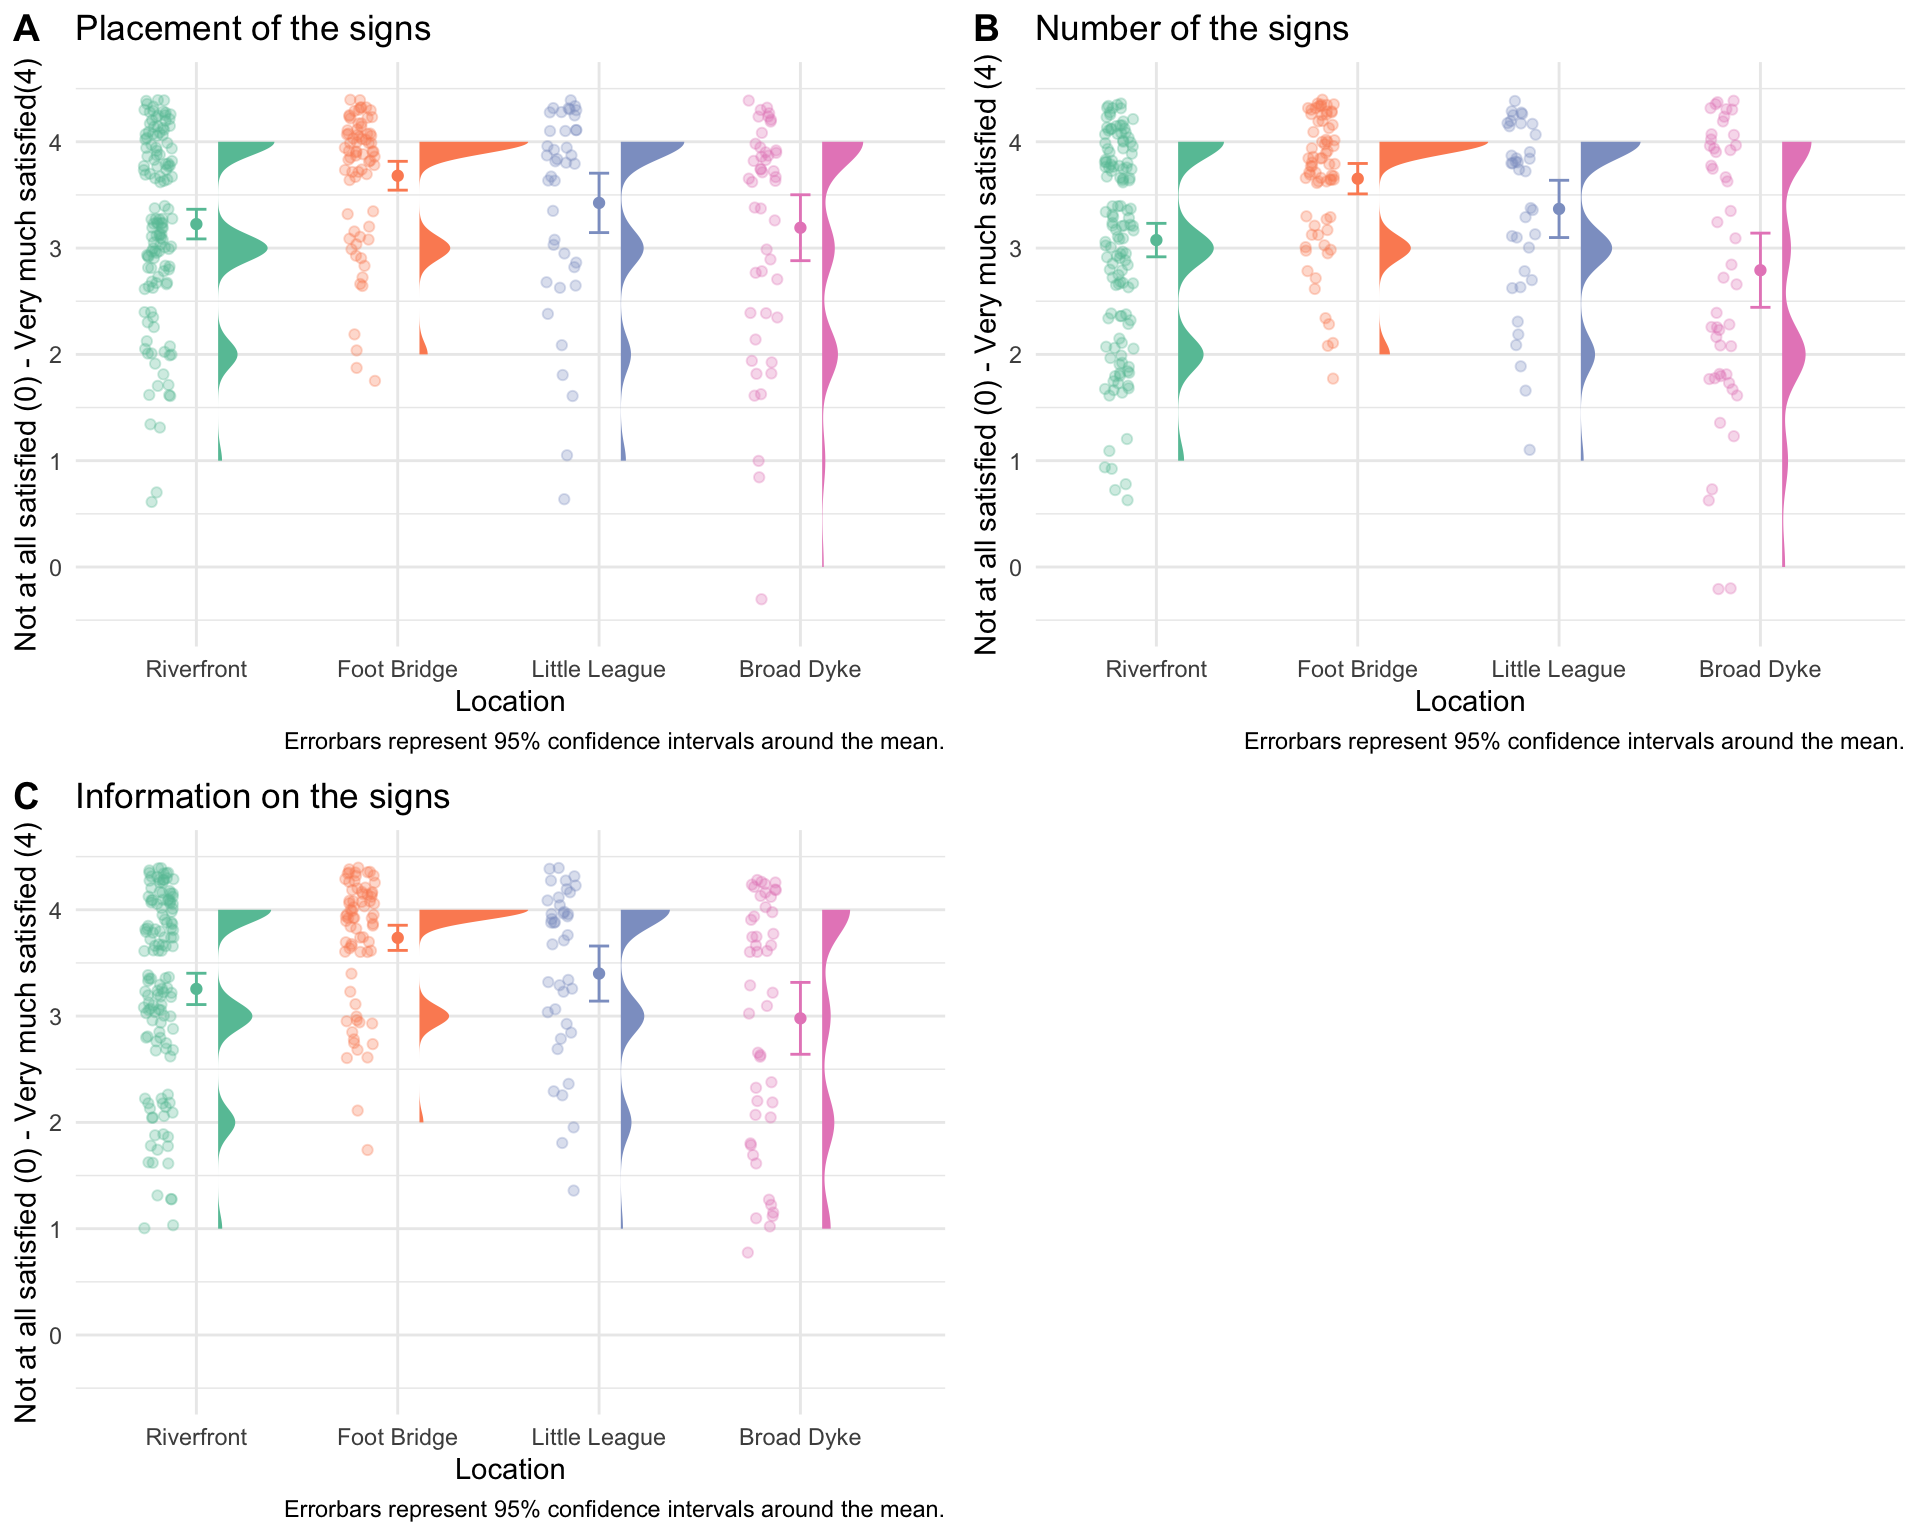
Figure 23: Satisfaction on Signage
Trail users reported three favorite locations: the Riverfront, the Foot Bridge, and the Broad Dyke
We created a heatmap for the locations that participants marked as their favorites. Figure 24 shows the results. Based on this map, we identified the following points of interest: (a) the Riverfront area, (c) the Foot Bridge area, and (c) the Broad Dyke area. These results suggest that the trail users’ favorite spots are the Riverfront, the Foot Bridge, and the Broad Dyke areas.
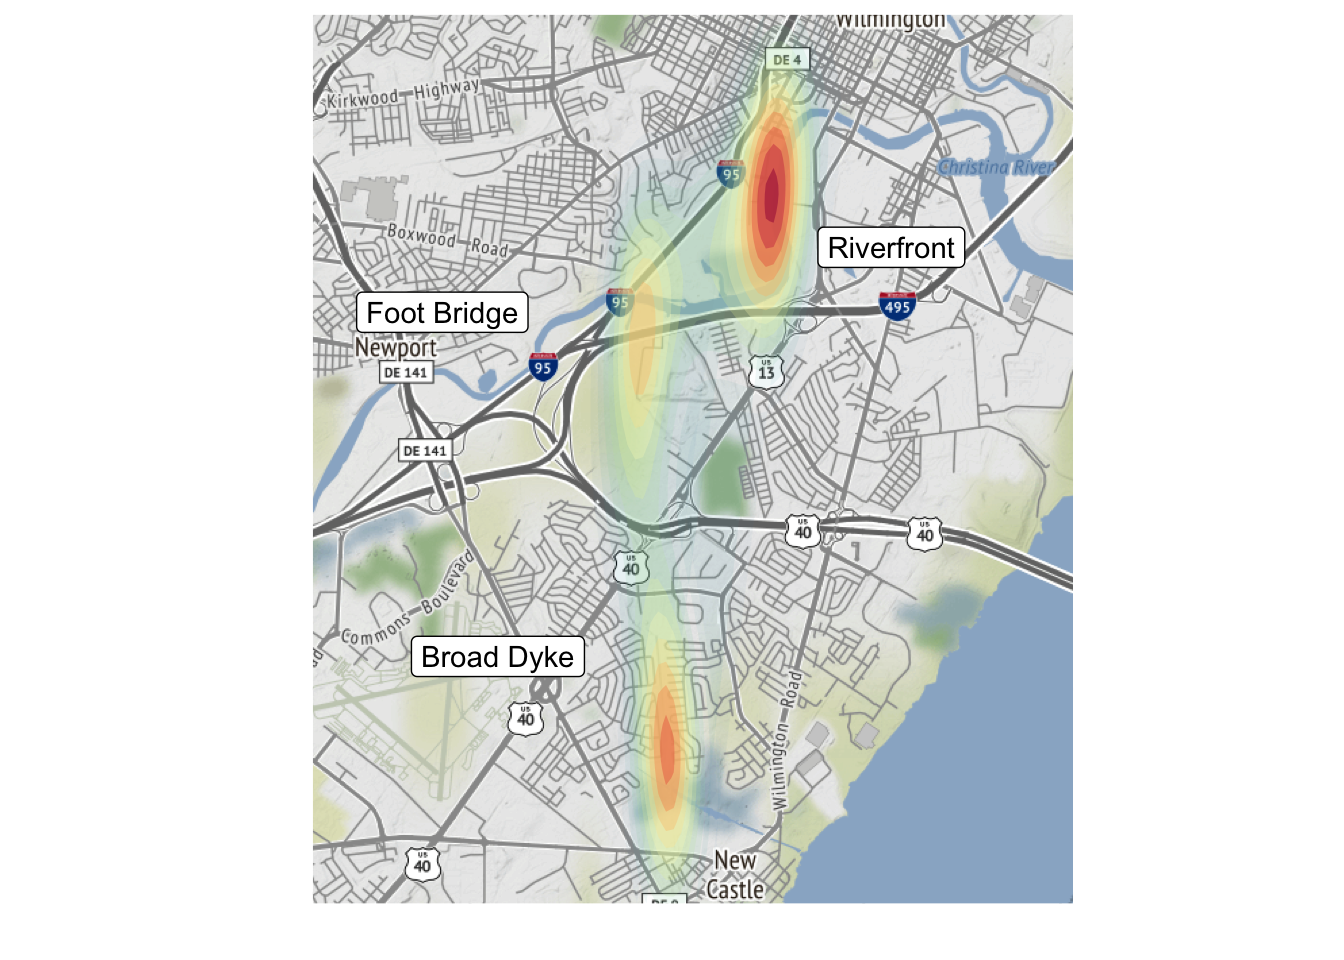
Figure 24: Favorite locations
What do people want to see improved about the trail?
We asked participants about the things that they want to see imprved about the trail. We created a word cloud below (Figure 25). We found that people mention about bathrooms, lights, and trashes when asked about what can be improved about the trail.
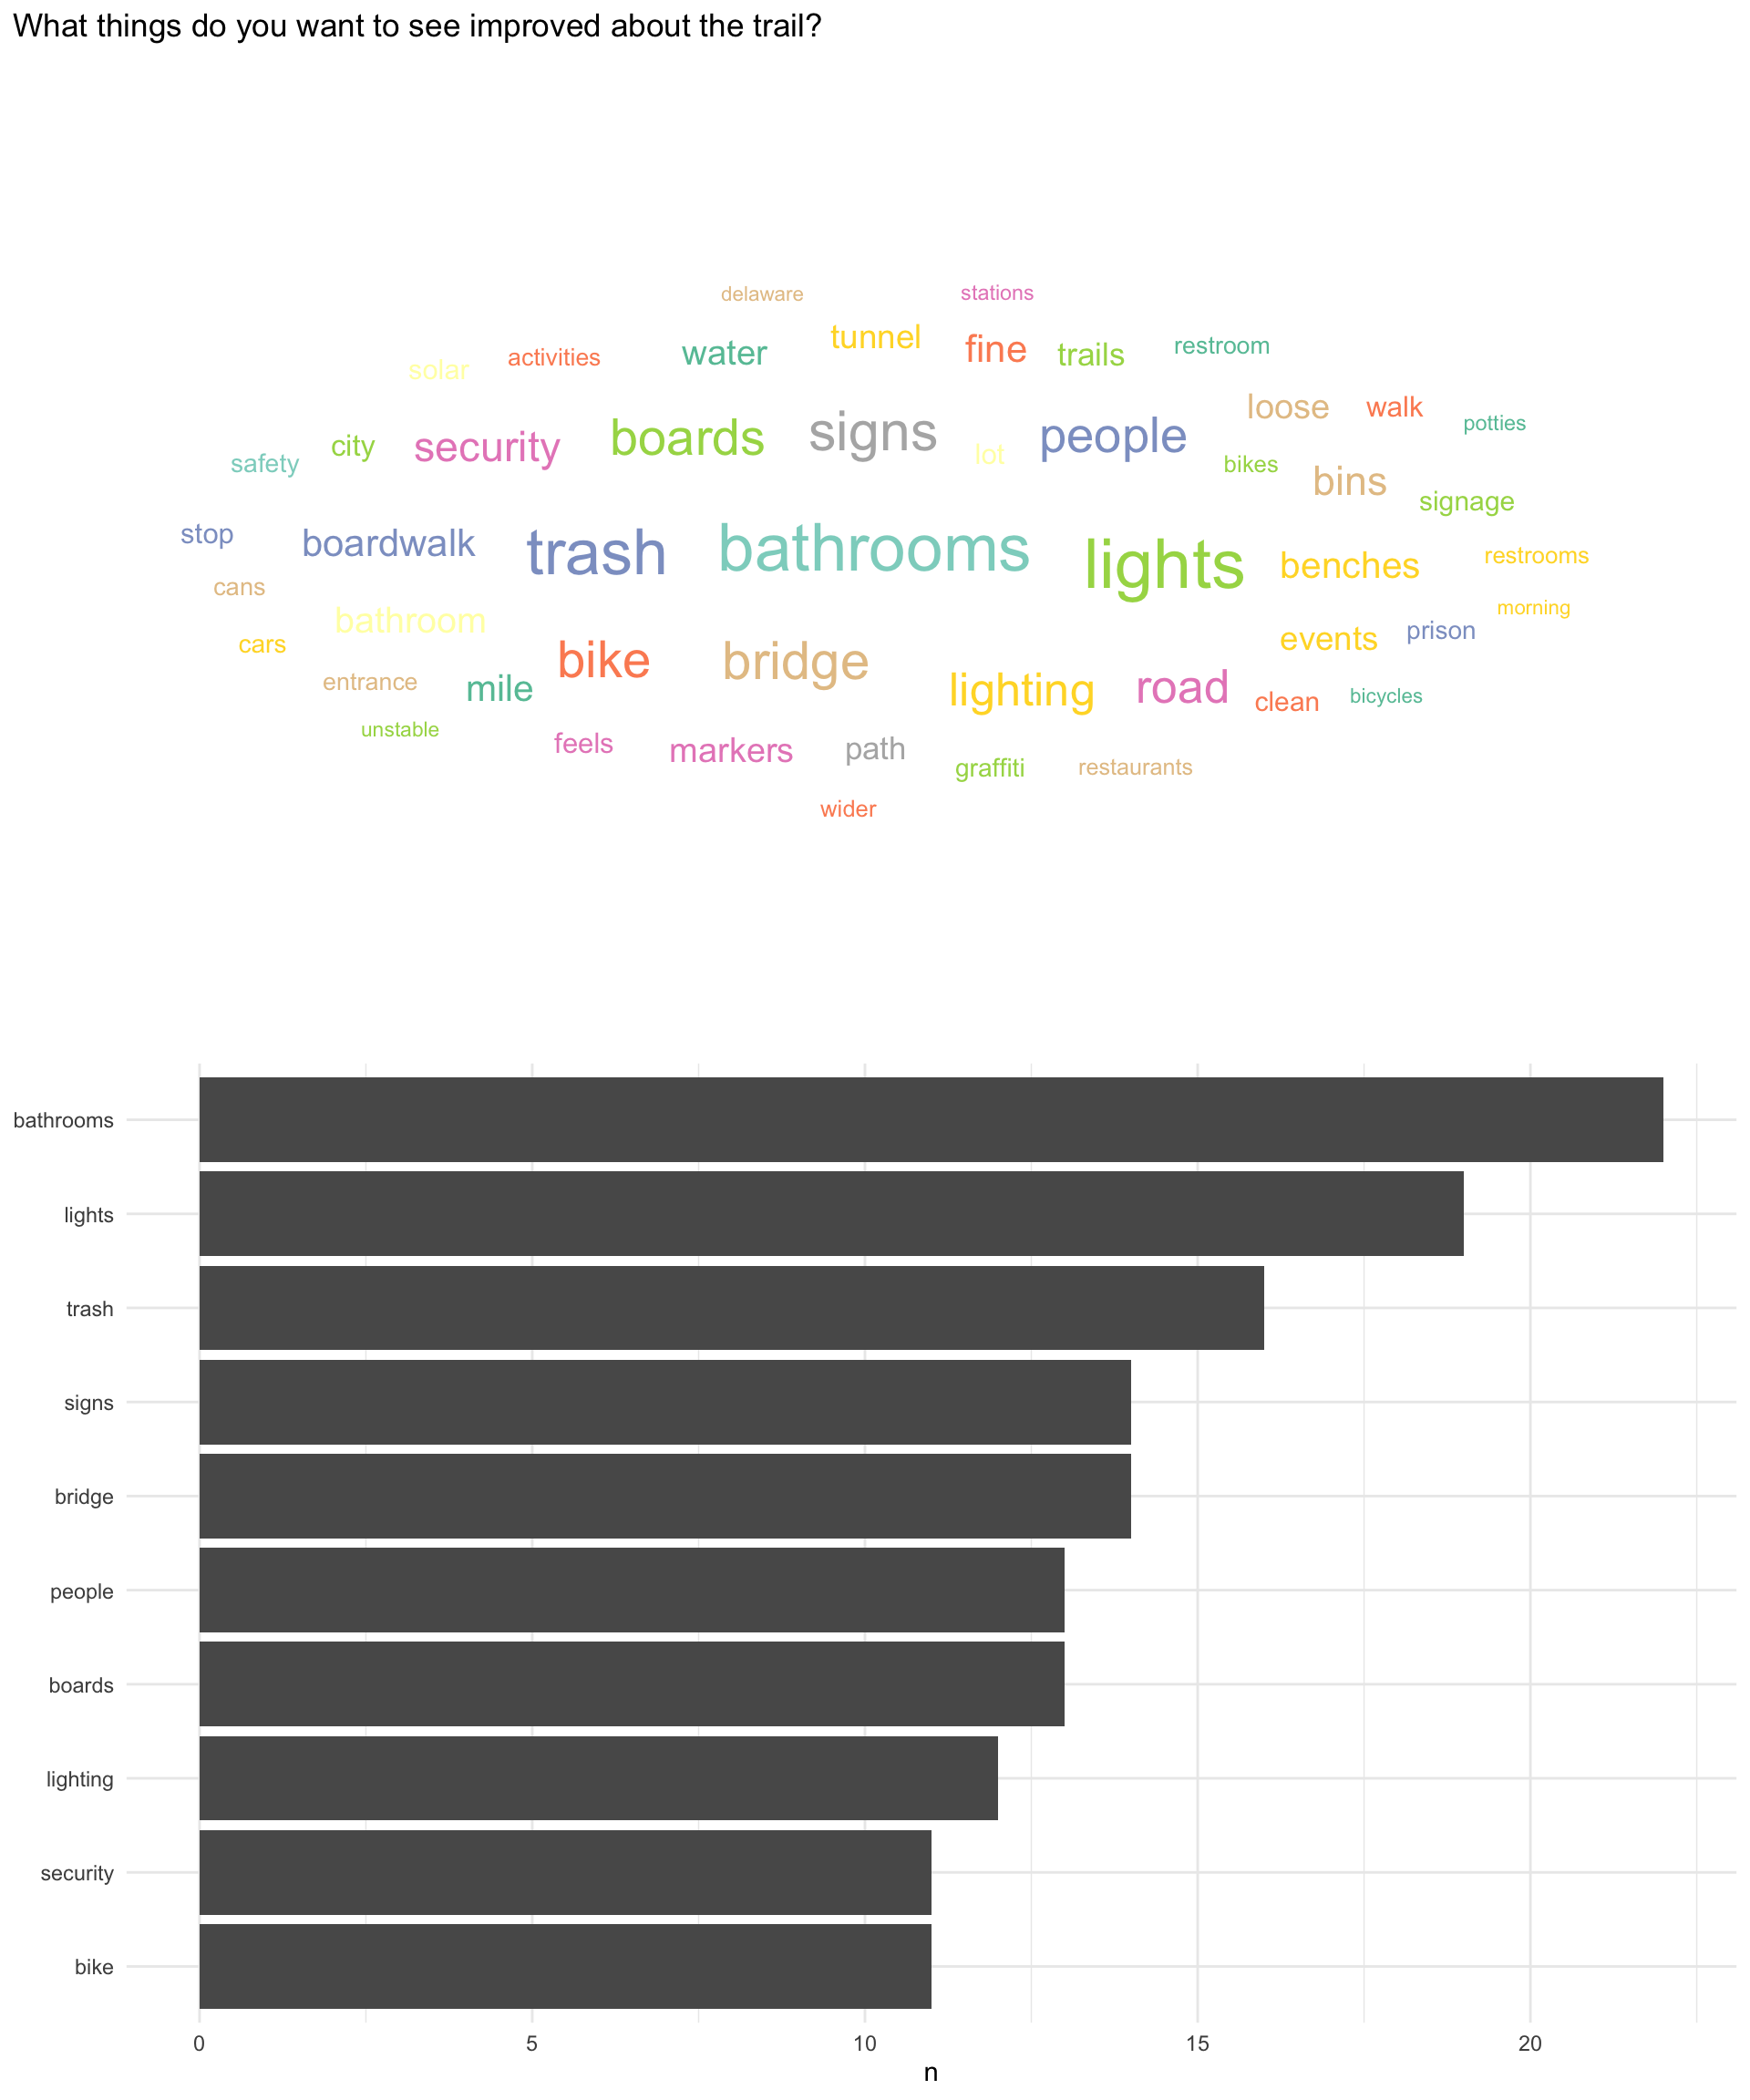
Figure 25: Word cloud for the question, What things do you want to see improved about the trail?